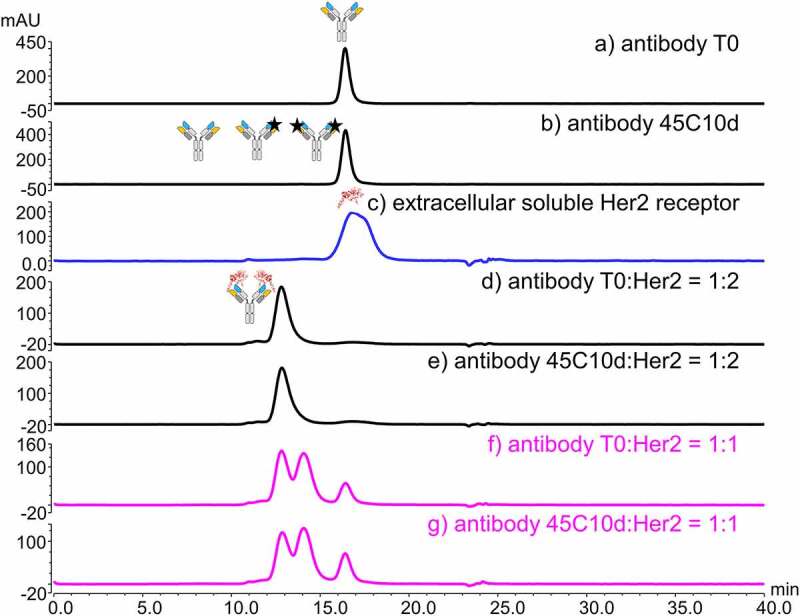
Figure 2.

SEC-UV profile (280 nm) of (a) antibody, (b) stressed antibody (45°C 10 days, 45C10d), black stars represent modified Fab arms on unbound antibody, (c) HER2, represented on the figure by a minimized crystallographic image from Figures 1 and 9, and (d-g) the antibody-receptor and stressed antibody-receptor mixtures at different binding ratios. The binding ratio and material used for each binding experiment is indicated in the corresponding panel. Cartoons of antibody, receptor, and antibody-receptor complex are shown on top of each assigned peak based on SEC-UV data. Panels f-g show competitive binding when the receptor is in deficit, and antibody species need to compete to crease the antibody-receptor complex
