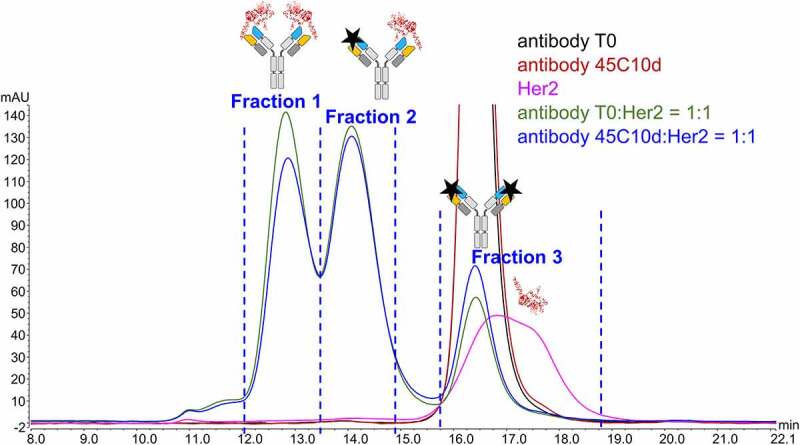
Figure 4.

SEC-UV (280 nm) profile of antibody T0 (black), antibody 45°C 10 days (45C10d, red), HER2 (magenta), antibody T0/receptor mixture (green), and antibody 45C10d – receptor mixture (blue). A ratio of 1:1 was used to generate the antibody T0/receptor and antibody 45C10d – receptor mixtures. Blue dashed lines delineate the regions for fraction collection of antibody 45C10d – antigen mixture. Cartoons of antibody, receptor, and antibody-receptor complexes are shown on top of each assigned peak based on SEC-UV-MALS data
