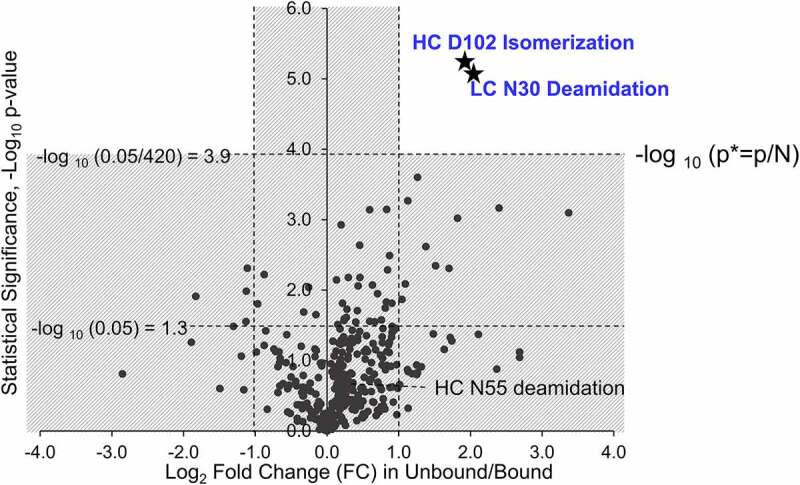
Figure 6.

Volcano plot for criticality assessment of antibody attributes. The x-axis represents the log2 values of the ratio between unbound and bound, and the y-axis represents the negative log10 value of p-value. For reference, the vertical dashed lines correspond to ±0.6, suggesting a ratio of 1.5 between the unbound and bound species. Three horizontal dashed lines represent two p-values: 0.05 and 0.05/420
