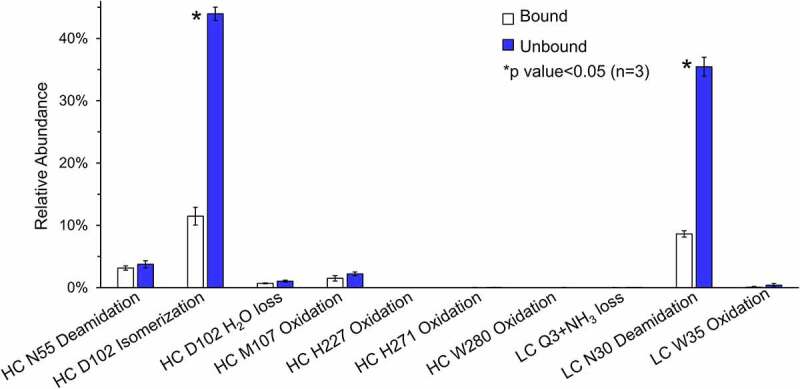
Figure 8.

Relative abundance plots of selective attributes of antibody in the bound (white) and unbound (dark) species. The modifications with a p-value that is smaller than 0.05 are labeled with asterisk signs, and the p-value is determined from triplicate measurements
