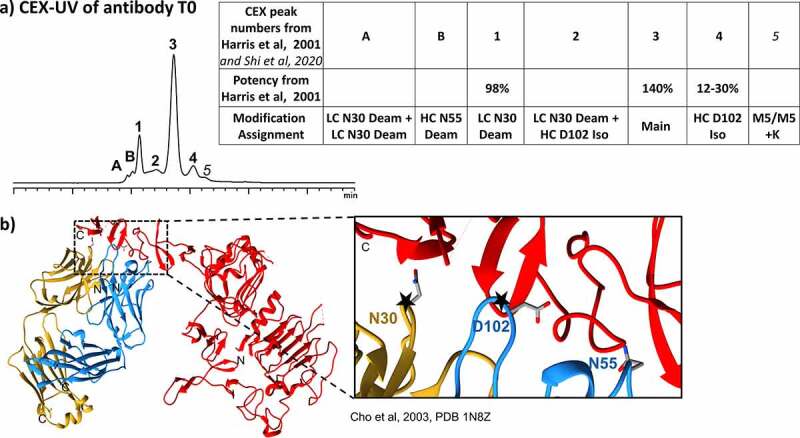
Figure 9.

(a) CEX-UV profile of antibody T0 and features of each proteoform observed in the CEX experiments. Potency measurement of CEX peaks are also shown in the table on the right. (b) Crystal structure of antibody- HER2 complex (PDB: 1N8Z)30 and the closer view of the binding region with critical attributes shown in the right box
