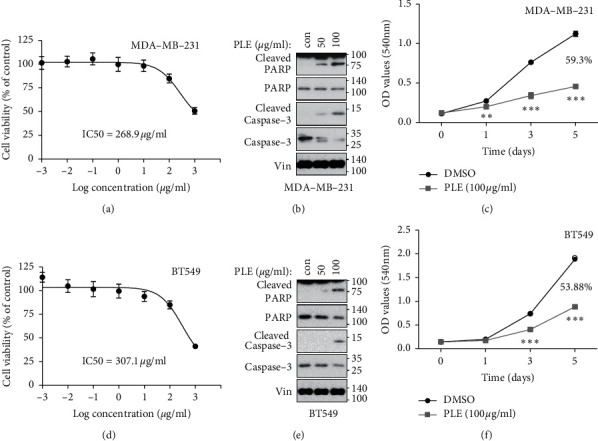
Figure 4.

Cytotoxic, apoptosis-inducing, and antiproliferative effects of PLE on MDA-MB-231 and BT549. (a, d) MDA-MB-231 and BT549 cells were treated with various concentrations (0.001, 0.01, 0.1, 1, 10, 100, and 1000 μg/mL) of PLE for 24 h. Cell viability was measured by using the EZ-Cytox cell viability assay kit. IC50 values were determined from concentration response curves using Prism 5.0 Software. The IC50 value of MDA-MB-231 and BT549 cells was 268.9 μg/ml and 307.1 μg/ml, respectively. Error bars represent ± SEM from n = 3 per group. (b, e) To measure the levels of apoptosis-related protein, western blot was performed on MDA-MB-231 and BT549 cells treated with the PLE at 50 and 100 μg/mL for 12 h. The lysates were immunoblotted with anti-PARP, cleaved PARP, Caspase-3, and cleaved Caspase-3. (c, f) MDA-MB-231 and BT549 cells were treated with DMSO and 100 μg/mL PLE, and the medium with diluted PLE was refreshed every two days. After treatment for another 5 days, cell proliferation was determined by using SRB assay at an absorbance of 540 nm. The proliferation of MDA-MB-231 and BT549 cells with PLE was decreased by 59.3% and 53.88%, respectively, compared with control cells. Bars represent mean ± SEM (n = 3). ∗∗∗p < 0.001, ∗∗p < 0.01; Student's t-test (unpaired, one-tailed) was used for statistical analysis.
