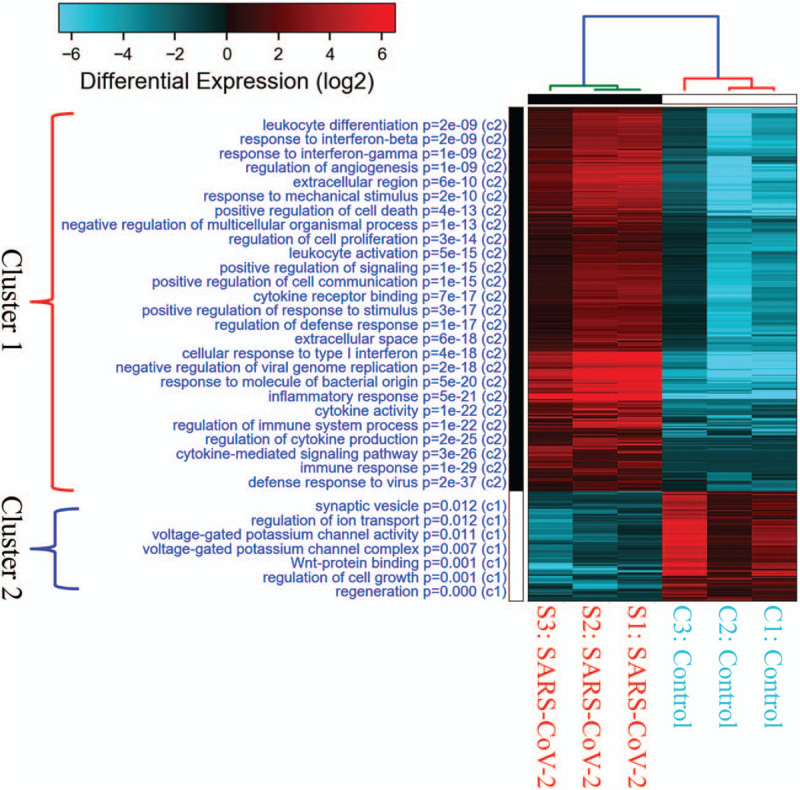
Figure 3.

Gene ontology enrichment analysis and heatmap visualization of severe acute respiratory syndrome coronavirus-2-infected human lung adenocarcinoma. SARS-CoV-2-infected 24 hour cells (n = 3) were compared to mock-infected controls (n = 3) from from GSE147507 database, Enriched pathways were grouped into 2 clusters. Pathways in cluster 1 were closely related to SARS-CoV-2 infection with lower P values than those in cluster 2. The highly differentially expressed genes were classified by Gene Onology and expressed as a heatmap. Up-regulated genes are in red, and downregulated ones are in blue.
