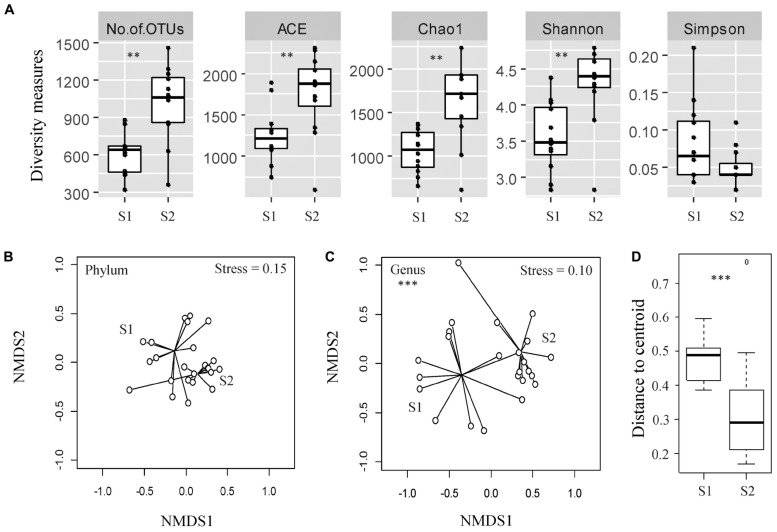
FIGURE 1.
Assessment of alpha- and beta-diversity of fecal samples taken from the same cohort of veal calves at early (Sampling 1/S1, n = 12) and late (Sampling 2/S2, n = 12) stages of production. (A) Alpha-diversity measures of individual samples from calves from same cohort at S1, S2. (B,C) Non-metric multidimensional scaling (NMDS) plots based on Bray-Curtis distance matrix encompassing 24 datasets from the two stages of veal production. (D) Distance to centroid from the multivariate homogeneity of groups dispersions test. Triple asterisks (∗∗∗) represent statistical significance with p < 0.001, double asterisks (**) represent p < 0.01, a single asterisk (*) represents p < 0.05, and no asterisk represents no observed statistical significance.

