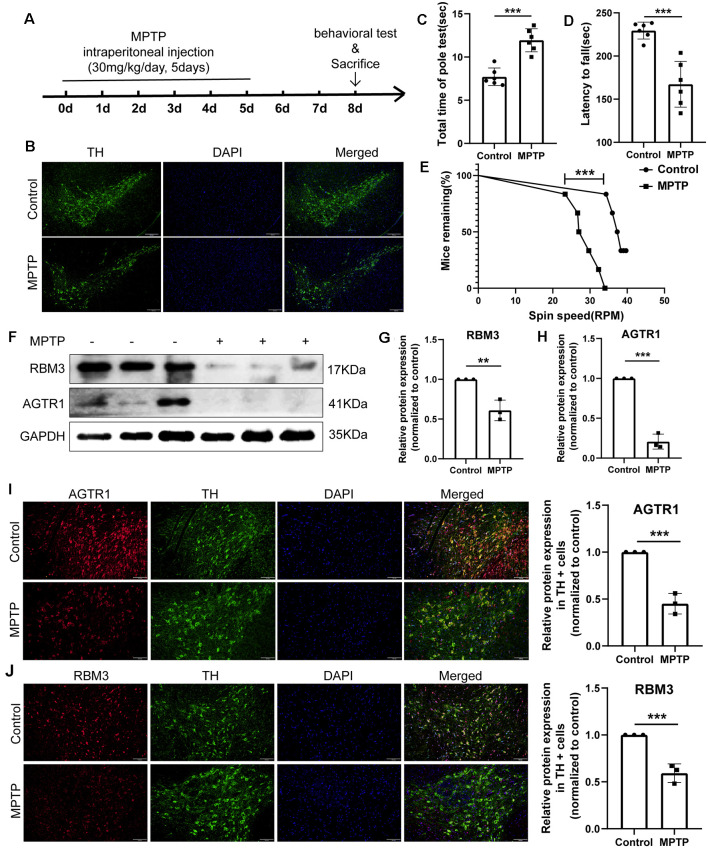
Figure 10.
The relative protein expression levels of RBM3 and AGTR1 in the PD animal model. (A) The flowchart of the construction of the MPTP subacute model, behavioral tests, and sacrifice. (B) Tyrosine hydroxylase (TH) staining of the substantia nigra (SN) of the above mice. Scale bars: 200 μm. (C) Pole tests were conducted by a blinded observer after MPTP treatment. (D,E) Rotarod tests were conducted by a blinded observer after MPTP treatment. (F–H) Western blot analyses of RBM3 and AGTR1 in SN of the above mice. (I) The co-localization of AGTR1 and TH in SN of the control group and MPTP group was detected by fluorescence microscope after immunofluorescence staining. Scale bars: 100 μm. (J) The co-localization of RBM3 and TH in SN of two groups was detected by fluorescence microscope (**p < 0.01, ***p < 0.001 vs. Control group).

