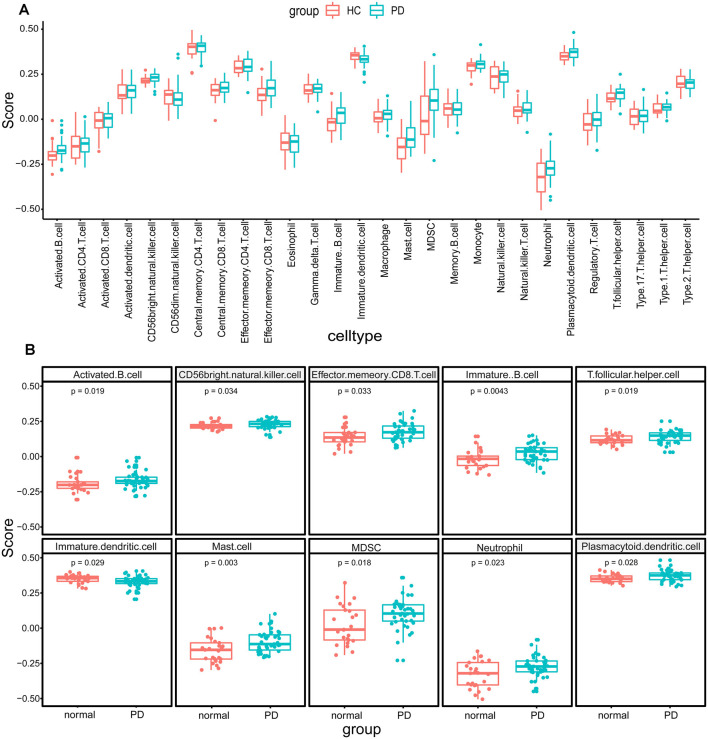
Figure 2.
The immune cell infiltration analysis of substantia nigra between Parkinson’s disease patients (PDs) and healthy controls (HCs). (A) The landscape of immune cell infiltration based on expression data from the Gene Expression Omnibus (GEO) database. (B) The immune cell types with significant differences between PDs and HCs.

