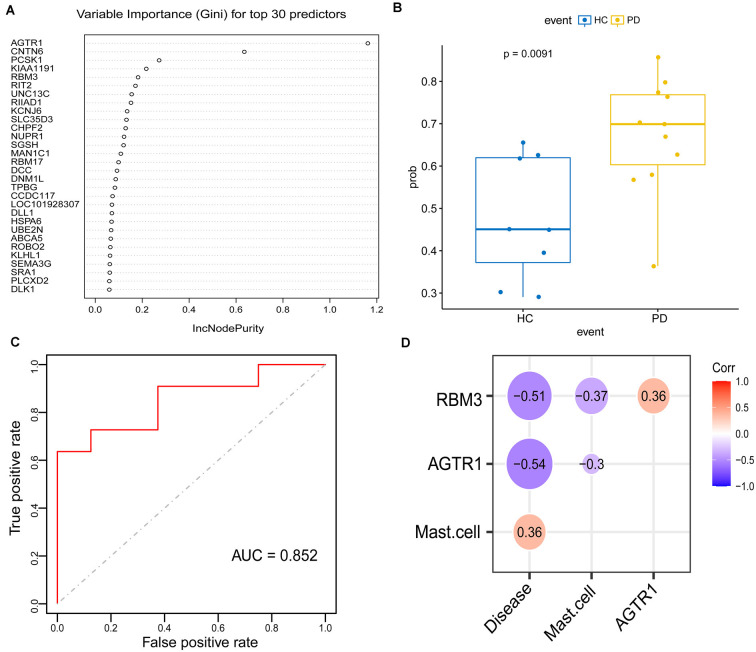
Figure 6.
Construction and validation of the random forest (RF) model in PDs. (A) Top 30 genes based on the parameter of increase in node purity in RF analysis. (B) The distribution of the RF model is based on these 30 genes in the testing cohort. (C) ROC curve of RF model for differentiating PDs from HCs of the testing cohort. (D) The correlation between the intersection gene of lasso and RF analysis (RBM3, AGTR1), mast cell, and disease state.

