Figure 9.
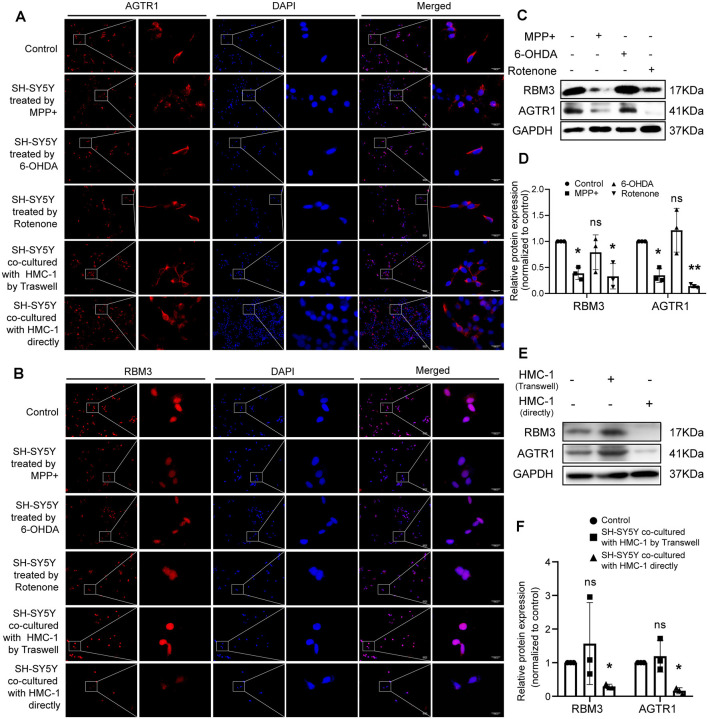
The protein relative expression levels of RBM3 and AGTR1 in PD cell culture model. (A) AGTR1 expression level in each treated group was detected by fluorescence microscope after immunofluorescence staining. Scale bars: 100 μm; 1,000 μm. (B) RBM3 expression level in each treated group was detected by fluorescence microscope after immunofluorescence staining. (C,D) Western blot analyses of specific genes’ expression in SH-SY5Y cells treated by MPP+, 6-OHDA, and Rotenone. GAPDH was used as an endogenous control. (E,F) Western blot analyses of specific genes’ expression in SH-SY5Y cells co-cultured with HMC-1 by Transwell or directly. GAPDH was used as an endogenous control (ns p > 0.05, *p < 0.05, **p < 0.01, vs. Control group).

