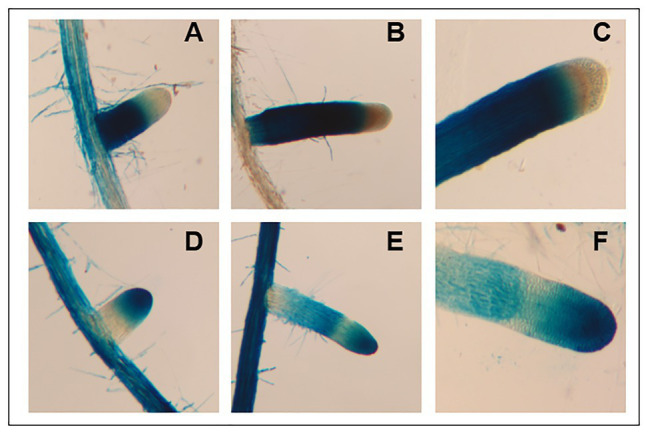
Figure 9.

Imaging and staining of 12-day-old AtFUT4::GUS and AtFUT6::GUS seedlings. Multiple (n > 15) independent AtFUT4::GUS and AtFUT6::GUS plant lines are generated, grown, and observed for each construct. Visualization and qualitative analysis of GUS staining patterns of roots for two representative lines are shown. Staining patterns for lateral roots of increasing lengths are shown in (A,B,D,E), while close-ups of tap roots are shown in (C,F). (A,B) AtFUT4::GUS-1, (C) AtFUT4::GUS-2, (D,E) AtFUT6::GUS-1, and (F) AtFUT6::GUS-2.
