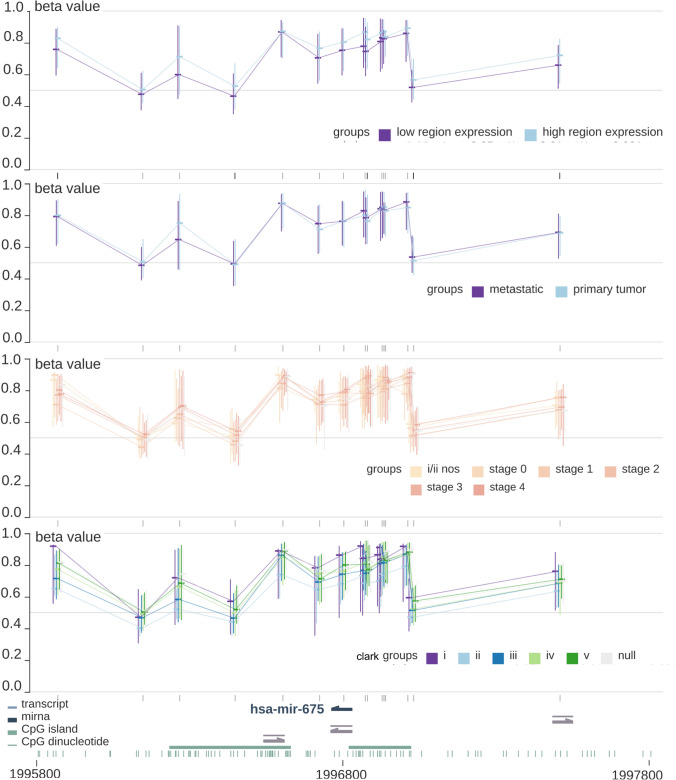
Fig. 3.
The relationship between DNA methylation, miR-675-3p expression, and clinical features. A beta value was calculated for each CpG target with Illumina's Bead Studio software with the Methylation Module v3.2. All p values were greater than 0.05 indicated the level of DNA methylation level was not significantly associated with miR-675-3p expression (low/high), sample type (primary/metastatic), tumor stage (simplified), or Clark’s level

