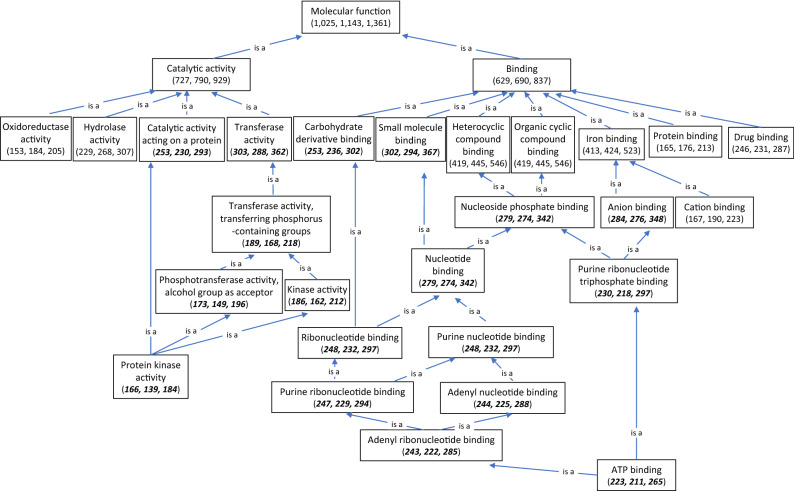
Figure 3.
Hierarchical diagram of molecule function according to 1361 annotated genes that were differentially expressed under dry and wet conditions in TAM 111 and TAM 112. Numbers in parenthesis indicate the number of genes in each molecule function with the first number indicating genes of TAM 111 followed by that of TAM 112 and the total number of the unique genes in both cultivars combined. Numbers in bold and italic font style showed that TAM 111 had a higher number of DEGs for the corresponding molecule function, which were different from the majority where TAM 112 had a higher number of DEGs.

