FIGURE 2.
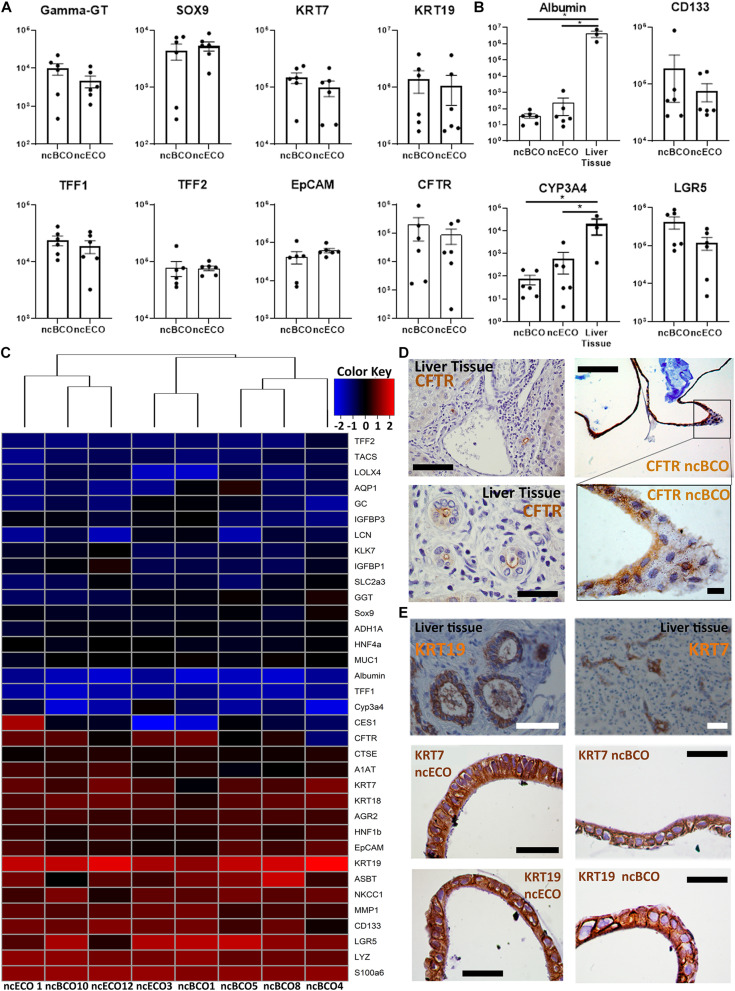
Gene and protein expression between bile-derived cholangiocyte organoids (ncBCOs) and extrahepatic cholangiocyte organoids (ncECOs) is similar. (A) Gene expression profiles of selected genes between ncECOs (n = 6) and ncBCOs (n = 6) for eight mature cholangiocyte-related genes relative to the reference gene hypoxanthine-guanine-fosforibosyl-transferase (HPRT) (for characteristics of organoid lines or gene and primer details see Supplementary Data Tables 1, 2). Error bars are presented as standard error of the mean (SEM). (B) Gene expression profiles of selected hepatocyte and stemness/Wnt-target-genes between ncECOs (n = 6), ncBCOs (n = 6), and liver-biopsies (n = 3) relative to the reference gene HPRT, indicating that ncECOs and ncBCOs have very low expression of hepatocyte-related genes: Albumin and Cyp3A4, and they have similar expression of stemness/Wnt-target-related genes. Error bars are presented as SEM. (C) Gene-expression profiles of ncBCOs and ncECOs are highly similar for these 35 selected genes. The included genes were selected based on published results by Sampaziotis et al. (2017)Figure 1D along with additional Wnt-target, cholangiocyte and hepatocyte related genes (Huch et al., 2015) and were quantified by qRT-PCR (see Methods and Supplementary Data Table 2). Euclidean hierarchical clustering did not show a significant segregation of gene-expression between ncECOs and ncBCOs. (D) Immunohistochemistry (IHC) staining of cystic fibrosis transmembrane conductance regulator (CFTR) in ncBCOs showing polarization of our organoids and luminal CFTR expression, similar to liver biopsies, top row scale bars indicate 200 μm, bottom scale bars indicate 50 μm. (E) Immunohistochemistry of ncBCOs and ncECOs showing comparable staining of cytokeratin, (KRT)19, and KRT7. Moreover, it reveals a columnar-like cell, resembling primary cholangiocytes as shown on liver tissue coupes. All scale bars in IHC pictures of ncECOs and ncBCOs represent 25 μm, and all scale bars from the liver biopsy pictures represent 100 μm.*Statistical significant difference (P < 0.05).

