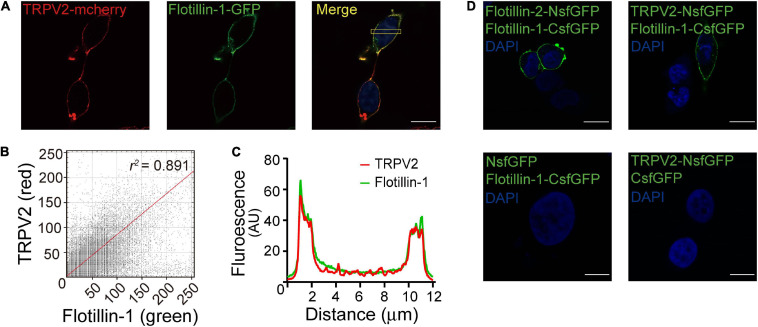
FIGURE 2.
Fluorescence images show co-localization of TRPV2 and flotillin-1. (A) Co-localization of TRPV2 and flotillin-1. HEK 293T cells were co-transfected with mcherry-TRPV2 (red) and GFP-flotillin-1 (green) and examined with confocal microscopy. In the merged images, the extensive co-localization of the two proteins was represented by yellow. (B) The fluorescence intensity scatterplot showed a clear linear relationship, with a Pearson’s correlation coefficient value of 0.891. (C) The plot of fluorescence intensities between the red and green pixels along a section through the cell body as indicated in (A) indicated a well-correlated relationship between green and red. (D) Validation of the interaction between TRPV2 and flotillin-1 by bimolecular fluorescence complementation (BiFC) analysis. The confocal images of HEK 293T cells co-expressed with the indicated constructs, showing that strong fluorescence at the cell membrane region for that co-expressing TRPV2-NsfGFP and flotillin-1-CsfGFP, which is line with the green fluorescence observed from the BiFC complex formed by flotillin-1-CsfGFP and flotillin-2-NsfGFP. No detectable sfGFP fluorescence for HEK 293T cells co-expressed with NsfGFP and flotillin-1-CsfGFP or the combination of TRPV2-NsfGFP and CsfGFP. Nuclei were stained with DAPI. Scale bar: 10 μm. Data are representative of three independent experiments.

