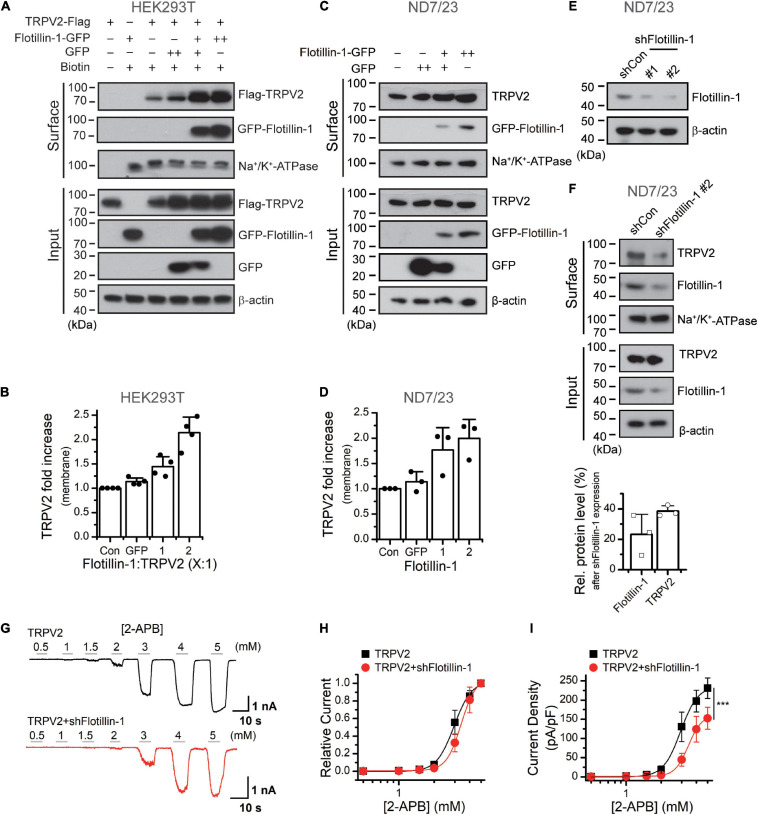
FIGURE 4.
Flotillin-1 enhances the surface expression levels of TRPV2. (A) Increased surface expression of TRPV2 by flotillin-1. HEK 293T cells were transiently transfected with TRPV2 with GFP or increased flotillin-1 as indicated. Surface levels of TRPV2 were measured by IB after plasma membrane proteins were biotinylated and purified with NeutrAvidin agarose beads. β-actin and Na+/K+ ATPase were used as controls for cytoplasmic and membrane proteins, respectively. (B) Quantitative analysis of the fold increase of TRPV2 on the plasma membrane by co-expression with flotillin-1 in HEK 293T cells (n = 4; means ± SD). (C,D) ND7/23 cells were transiently transfected with increasing amounts of flotillin-1-GFP cDNA. Similarly, surface levels of TRPV2 were measured by IB after plasma membrane proteins were biotinylated and purified with NeutrAvidin agarose beads. Blots are representatives of three independent experiments. Error bars represent SD. (E) Immunoblot analysis (with anti-flotillin-1) of ND7/23 cells transfected for 36 h with plasmids encoding flotillin-1-targeting shRNA (shFlotillin-1 #1, and shFlotillin-1 #2) or control shRNA (shCon) to test efficiency of shRNA. (F) Effect of knocking down flotillin-1 on the surface expression of TRPV2 in ND7/23 cells. The cell surface biotinylation assay was used to measure the surface levels of TRPV2 in ND7/23 cells that were stably transfected with shCon or shFlotillin-1 #2. Below showing the quantitative analysis of the relative protein levels of TRPV2 and flotillin-1 caused by shFlotillin-1 #2. Data are representative of three independent experiments. (G) Whole-cell recordings in HEK 293T cells expressed TRPV2 alone (upper), and TRPV2 + shFlotillin-1 (lower), showing that 2-APB dose-dependently activated TRPV2 channels. Holding potential was –60 mV. (H) Dose–response curves for 2-APB-evoked currents. Solid lines indicate fits with the Hill equation, which yielded EC50 = 2.95 ± 0.06 mM, nH = 5.84 ± 0.72 for TRPV2 (n = 8); and EC50 = 3.39 ± 0.02 mM, nH = 6.87 ± 0.17 for TRPV2 + shFlotillin-1 (n = 8). (I) Summary plot of current density. The current densities evoked by 2-APB were determined by normalizing the membrane peak current by membrane capacitance. (n = 8). ***P < 0.001.

