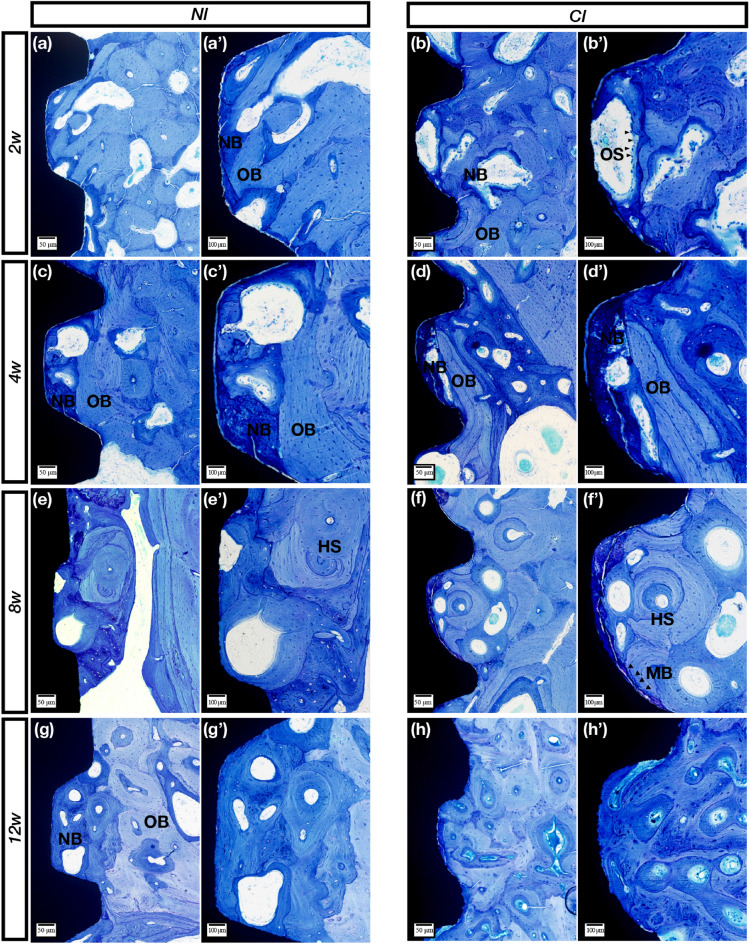
Figure 3.
Toluidine blue staining. (a,a′) Clearly, the new and old bone of the NIs is alternately meshed in the threads in the 2nd week. (b,b′) For the control group, a large piece of irregular bone resorption sag appeared on the control implant surface due to the activities of some osteoclasts (black arrows). (c,c′) In the 4th week, some NB with partial bone resorption formed on the surface. (d,d′) In the 4th week, NB (dark blue staining) was evident on the CI surface. (e,e′) In the 8th week, the Haversian system (HS) was observed, and the cellular components disappeared. (f,f′) Mineralized bone (black arrows) deposited around the control implants, and NB gradually matured. (g,g′) The boundary between new and old bone became more blurred, and NB gradually matured after 12 weeks. (h,h′) The bone around the control implants was dominated by mature bone at 12 weeks. OS (osteoclasts); NB (new bone); OB (old bone); (HS) Haversian system; (MB) mineralized bone. Scale bars represent 50 μm (a–h) and 100 μm (a′–h′); original magnification: (a–h) × 10, (a′–h′) × 20.

