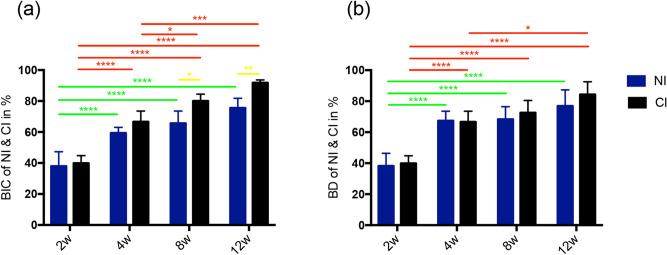
Figure 5.
Histomorphometry results of BIC and BD. (a) From the longitudinal analysis of the time series, the BIC of the NIs was not significantly different from that at the fourth week. The BIC of the CIs showed a significant difference between the 2nd week and the other time points. A significant difference still existed between the 4th, 8th and 12th weeks. From the horizontal analysis of the time series, the BIC between the two implants was not significantly different from the 2nd to 4th weeks, but the BIC of CIs was higher at the 8th and 12th weeks. (b) From the longitudinal analysis of the time series, the BD of the NIs was not significantly different from that at the fourth week. The BD of the CIs showed obvious significant differences between the 2nd week and the other time points. A significant difference still existed between the 4th and 8th weeks. From the horizontal analysis of the time series, the BD between the two implants was not significantly different from the 2nd to 12th weeks. p values smaller than 0.05 were considered significant: p < 0.05 (*); p < 0.001 (**); p < 0.0001 (****). BIC bone-to-implant contact, BD bone density.

