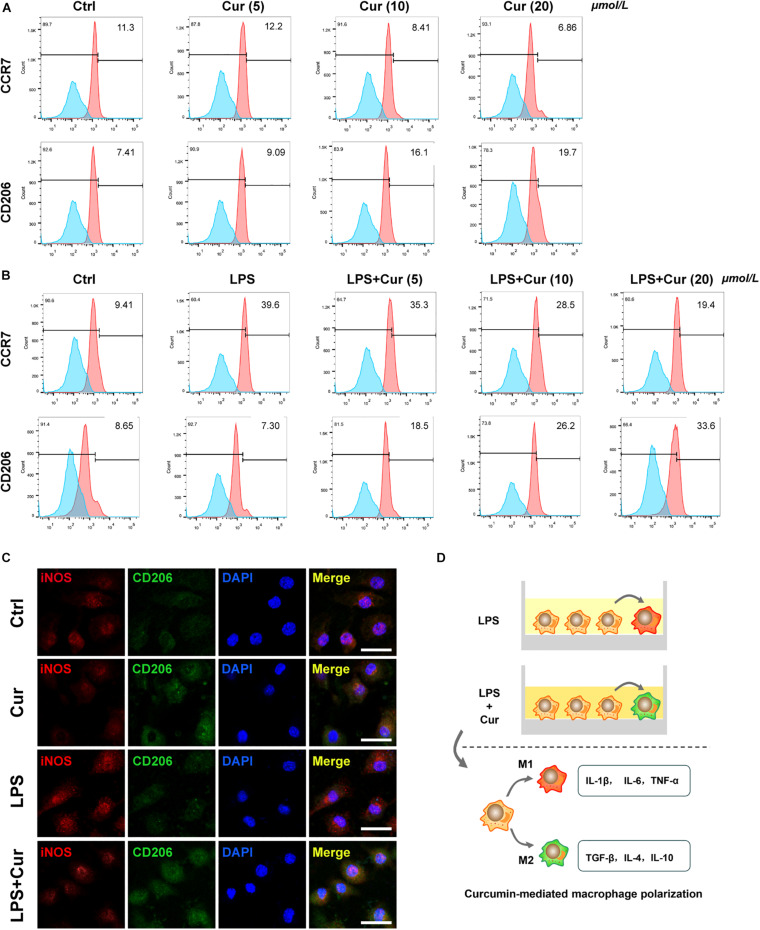
FIGURE 2.
(A,B) Flow cytometry analysis of CCR7 and CD206 (numbers are the percentage of the cells’ population at respective groups). (C) Immunofluorescent staining of macrophages with iNOS (red), CD206 (green), and nuclei (blue). Cur: curcumin (20 μmol/L). Scale bar = 5 μm. (D) Schematic diagram of curcumin-mediated macrophage polarization.

