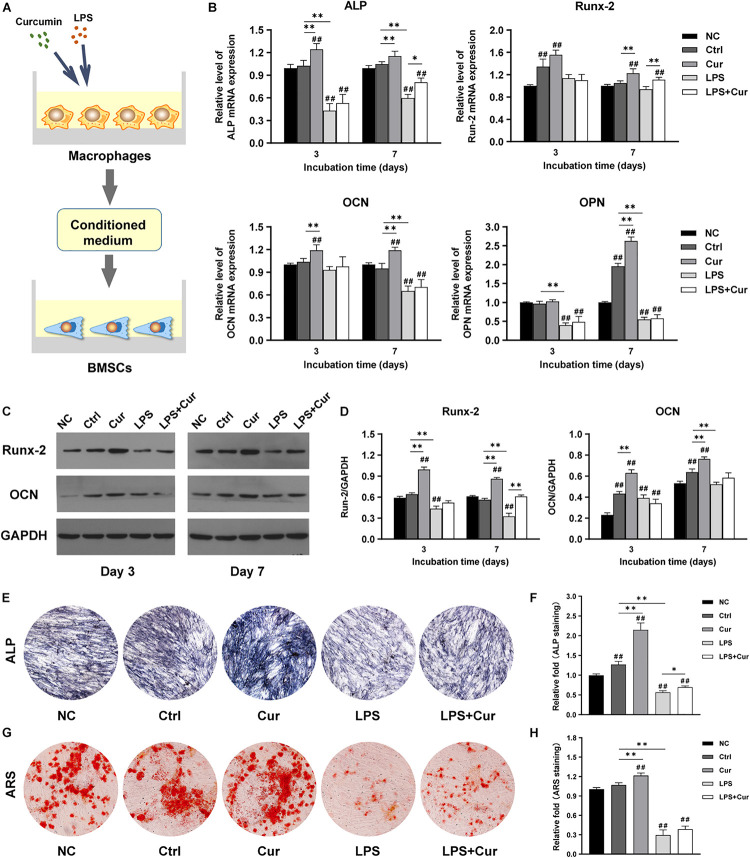
FIGURE 4.
(A) Schematic illustration. (B) Relative mRNA expressions of osteogenic gene ALP, Runx-2, OCN, and OPN in BMSCs stimulated by different CM for 3 and 7 days. (C) Western blot results of Runx-2 and OCN expression in BMSCs on days 3 and 7. (D) Quantitation of the protein expression levels of Runx-2 and OCN. (E,F) ALP staining pictures and analysis of the BMSCs cultured in corresponding CM for 7 days. (G,H) ARS images and quantitative analysis of the BMSCs cultured with corresponding CM for 14 days. ##P < 0.01, compared with the NC group. ∗P < 0.05, ∗∗P < 0.01.

