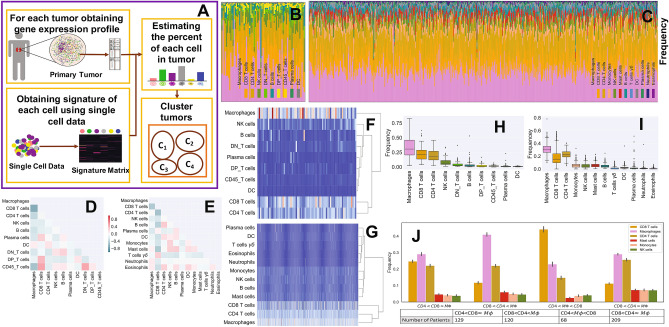
Figure 1.
Immune pattern of ccRCC. Sub-figure (A) (created using PowerPoint v16.44) represents the algorithm of digital cytometry and clustering applied on TCGA data. Sub-figures (B) and (C), respectively show the estimated percentage of each immune cell by mass cytometry analysis of 73 ccRCC patients done by Chevrier et al.14 (B) and digital cytometry on 526 TCGA ccRCC tumors (C). Sub-figures (D) and (E) indicate the correlation map of estimated immune cell frequencies in 73 ccRCC tumors (D) and TCGA ccRCC tumors (E), respectively. Sub-figures (F) and (G) show the cluster heat map of immune cell frequencies in 73 ccRCC tumors (F) and TCGA ccRCC tumors (G). Sub-figures (H) and (I) respectively show a box plot format of the immune cell percentages in 73 ccRCC tumors (H) and TCGA ccRCC tumors (I). Sub-figure (J) shows 4 distinct immune patterns of ccRCC tumors obtained by K-mean clustering of cell frequencies of TCGA ccRCC tumors. Sub-figures (B)–(I) have been created using TumorDecon19 (https://pypi.org/project/TumorDecon/).

