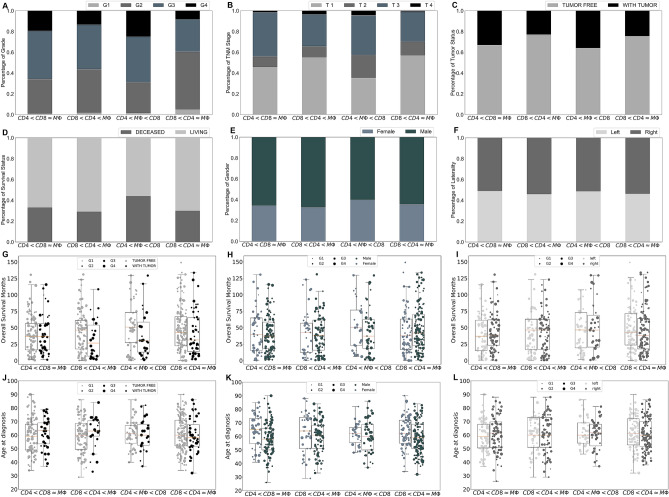
Figure 2.
Clinical features of each ccRCC tumor cluster. Sub-figures (A)–(F) show the percentage of patients with grade 1–4 (A), stage T1–T4 (B), with tumors or without tumors (C), alive or dead at the last time of follow up (D), female or male (E), and primary tumors in left or right kidney (F) for each cluster of ccRCC tumors. Sub-figures (G)–(I) and (J)–(L) respectively show the overall survival months and age of diagnosis of the patients in each cluster as a function of tumor status (G,J), gender (H,K), and the location of the primary tumor (I,L); the size of markers indicates the grade of tumors.

