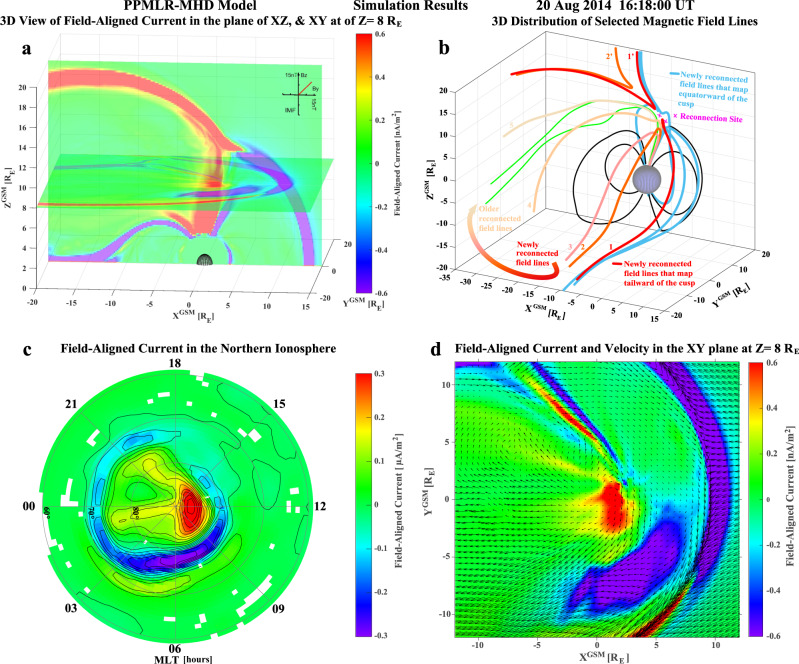
Fig. 4. 3-D and 2-D view of simulated FACs and selected magnetic field lines by the PPMLR-MHD code at the center time of the example in Fig. 2a.
a 3-D view of the simulated FACs in the GSM X–Z plane, and the X–Y plane at Z = 8 RE; b 3-D distribution of selected magnetic field lines with magenta crosses representing the reconnection sites and the numbered field lines in red to light brown representing the newly to old evolution of the reconnected field lines that also highlighted by the thick arrowed color curve; c 2-D distribution of simulated FACs in the northern polar ionosphere with FAC contour lines, and d close-up view of the 2-D distribution of FACs and plasma velocity vectors in the X–Y plane at Z = 8 RE.

