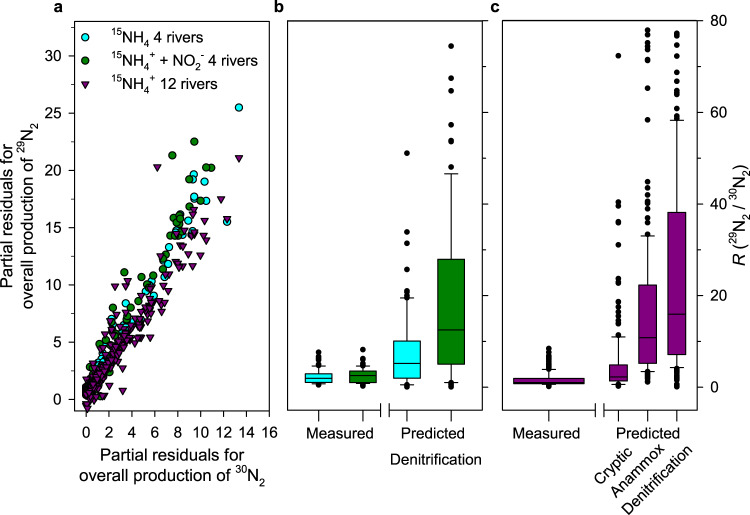
Fig. 3. Ratios of 29N2 and 30N2 production consistently below those predicted.
a Consistent 29N2 production (nmol g−1 h−1) from 15N-ammonia added to oxic sediments, against each corresponding measure of 30N2 production at each time-point (>0.5 h < 10 h) in each incubation in Fig. 1a presented here as the partial residuals from mixed-effects models (n = 100 and n = 300, for the 4- and 12-river datasets, respectively). b The corresponding measured values for R from a, for the first 4 rivers incubated with either 15NH4+ (95% CI for R = 2.01 to 2.64) or 15NH4+ and additional 14NO2− (95% CI for R = 2.12 to 2.74), against those predicted for denitrification of porewater NO2−. c Measured R values for the 12 river sediments incubated with only 15NH4+ (95% CI for R = 1.41 to 2.20), against predicted R values for denitrification, anammox, and a cryptic coupling. See main text and Table 2. Upper and lower box boundaries are 75th and 25th percentiles, respectively, upper and lower whiskers are 90th and 10th percentiles, respectively, the extreme outliers the maxima and minima and the horizontal line the centre, median value.

