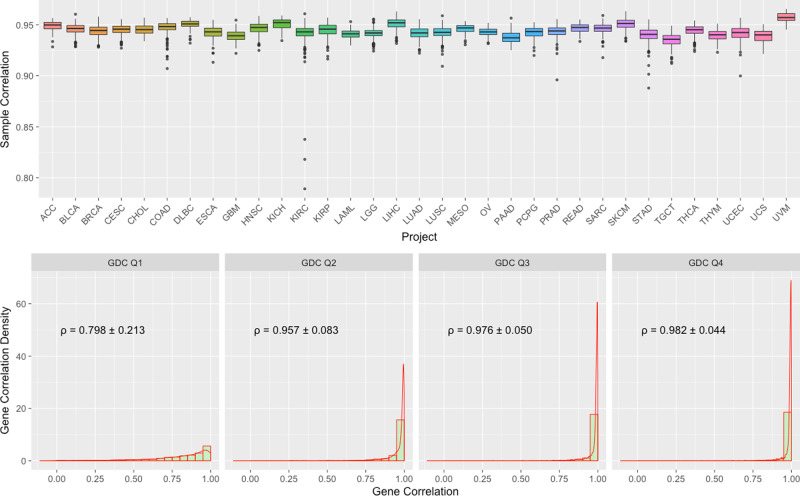
Fig. 4. Boxplots of Spearman correlation between GDC and TCGA mRNA expression.
Top: Boxplots of Sample to Sample Correlation between GDC and TCGA by Project. n = 79/427/1202/309/45/328/48/171/170/546/89/603/321/145/525/423/573/550/86/265/182/186/548/105/265/472/404/156/564/121/199/56/80 biologically independent samples for projects ACC/BLCA/BRCA/CESC/CHOL/COAD/DLBC/ESCA/GBM/HNSC/KICH/KIRC/KIRP/LAML/LGG/LIHC/LUAD/LUSC/MESO/OV/PAAD/PCPG/PRAD/READ/SARC/SKCM/STAD/TGCT/THCA/THYM/UCEC/UCS/UVM, respectively. Bottom: Combined Boxplots and Density Plots of Gene to Gene Correlation between GDC and TCGA. All genes are categorized by four GDC groups (Q1–4) based on their average expression values. Mean and standard deviation of gene to gene Spearman’s correlations are calculated by these four groups.

