
Figure 2.
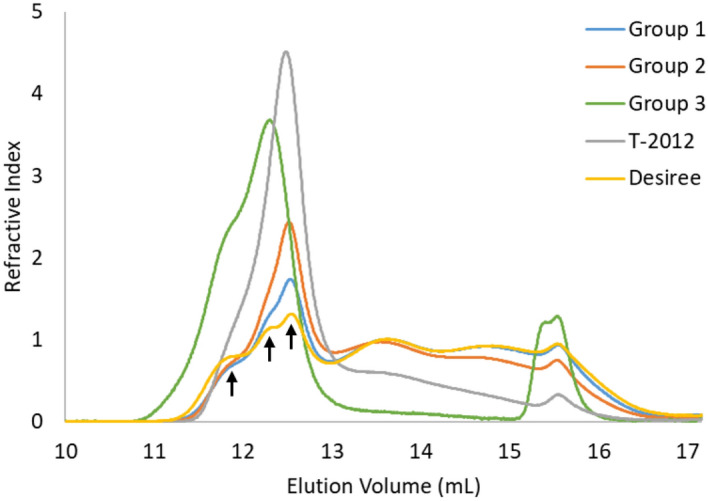
Chain-length distribution of debranched starches from the potato lines after normalisation for the peak area, analysed with HPSEC. The averages of the potato lines from Groups 1, 2 and 3 are shown. The parental variety Desiree and the high-amylose line T-2012 were included for comparison. The arrows from left to right point out the three populations of amylose chains, i.e. long, intermediate, and short chain amylose fraction, respectively. Software used is ASTRA software version 4.70.07 (wyatt.com/products/software/astra.html, Wyatt Technology Corp., Santa Barbara, CA).