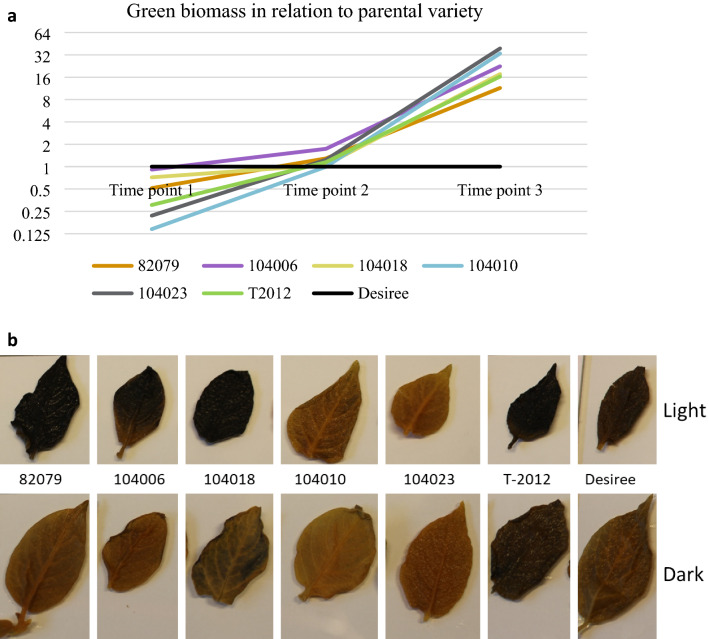
Figure 7.
Transitory starch and green biomass of plants grown in greenhouse. Lines analysed are; 82079 (Group 1), 104006 (Group 2), 104018 (Group 2), 104010 (Group 3), 104023 (Group 3), T-2012 and parental variety Desiree. (a) Green biomass measured with low-cost RGB imaging phenotyping lab using digiCamControl (digiCamControl v2,1,2, http://www.digicamcontrol.com) and Easy Leaf Area. All lines are normalised to the parental variety Desiree, which is set to 1. The results are a mean of three biological replicates. Note that the vertical axis has a logarithmic scale. (b) Leaf tissue of top shoots harvested after a light (top row) and dark period (bottom row) stained with iodine.

