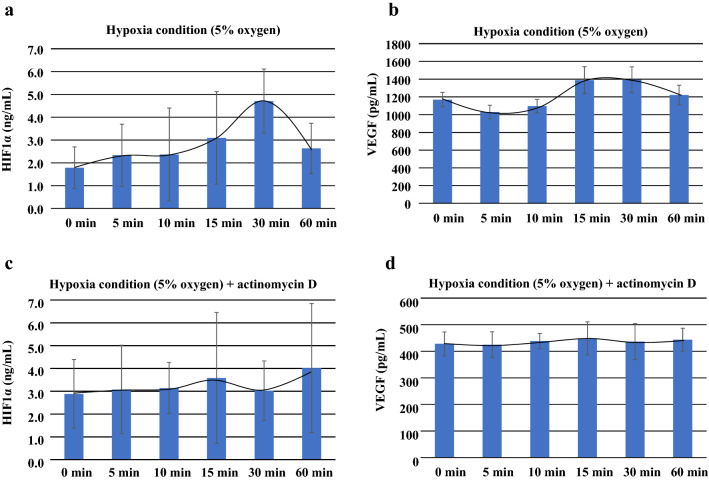
Fig. 10.
Graph shows the HIF1α and VEGF concentrations in the conditioned medium BRIN-BD11 that was cultured under hypoxic conditions. a Levels of HIF1α and VEGF, which were used as the hypoxia control markers for cellular function during the hypoxic conditions in the BRIN-BD11 cells, increased starting from 30 min in HIF1α. b The graph shows the VEGF concentrations from 15 min to 60 min, with the maximum reached from 15 min to 30 min. The figure also shows the HIF1α (c) and VEGF (d) levels after the addition of actinomycin D during the conditions of hypoxia. The addition of actinomycin D in the cultured cells during the hypoxia, led to smaller changes in both the HIF1α and VEGF

