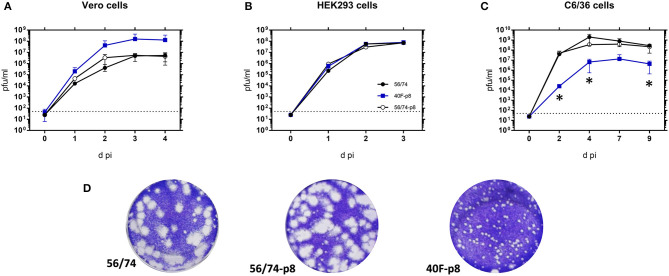
Figure 1.
Kinetics of growth in mammalian and insect cells. Vero cells (A) and HEK293 (B) were infected at a MOI of 0.01 while C6/36 mosquito cells (C) were infected with 0.005 pfu/cell. After 1 h of adsorption the inoculum was removed, cells were washed and fresh medium was added. Supernatants were collected at different times post infection (pi) and titrated on Vero cell monolayers Independent titrations were performed in duplicates in at least two independent experiments. Mean values ± SD are represented. Significance level was set to *P < 0.05 (multiple t-test using the Holm–Sidak method, with alpha = 5.000%). Data shown correspond to one representative experiment. (D) Plaque phenotypes of the indicated viruses on Vero cell monolayers.

