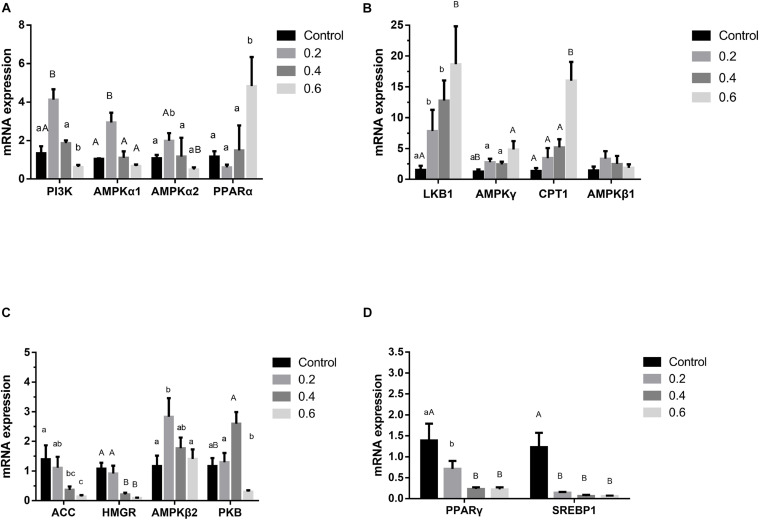
FIGURE 2.
Effects of quercetin on genes relating to the AMPK/PPARα signaling pathway in liver of AA broilers. Note: The results of relative quantification were expressed as 2– ΔΔCT. The quantification of control was 1, namely 2– ΔΔCT = 1. The value 2– ΔΔCT of treatment group was a multiple of control. N = 6. Mean values without a common letter are significantly different, P < 0.05. Values are mean ± SEM (n = 6).

