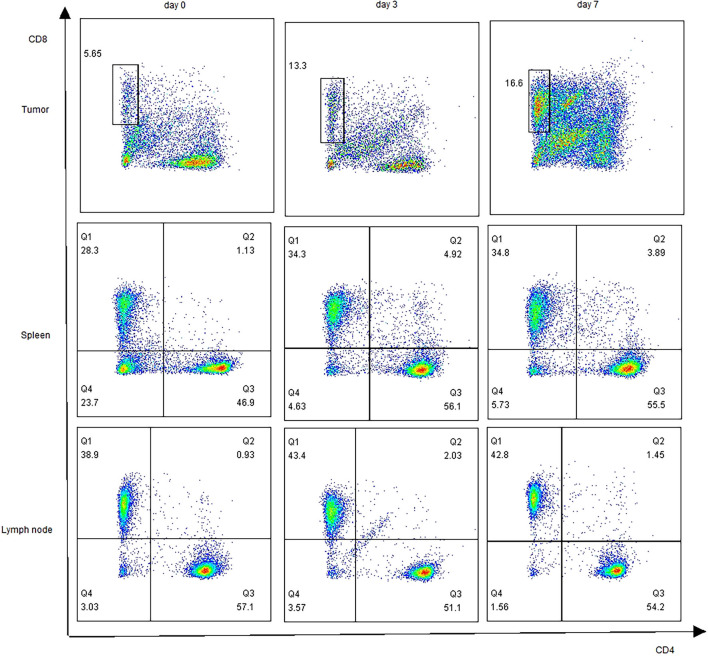
Figure 5.
Profiling of T cells after nsPEFs treatment. The ratios of CD4+/CD3+, CD8+/CD3+in response to nsPEFs treatment in the tumor tissue, spleen, and axillary lymph nodes on day 3 and 7. One representative flow cytometric graph for each pattern was shown here (n = 4). Data are presented as the mean ± SD. P-values were calculated based on a Student’s t-test (n = 4 per group).

