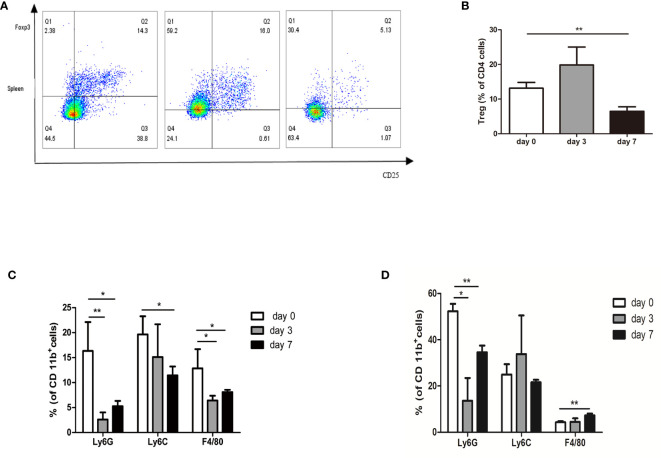
Figure 6.
Profiling of immune suppressive cells after nsPEFs treatment. (A) Frequency of Treg cells in response to nsPEFs treatment in the spleen on day 3 and 7. Analyses were performed on CD4+ cells. (B) Frequency of MDSCs (CD11b+Ly6G+ and CD11b+Ly6C+) and macrophages (CD11b+F4/80+) in the tumor on day 3 and 7. (C) Frequency of MDSC (CD11b+Ly6G+ and CD11b+Ly6C+) and macrophages (CD11b+F4/80+) in the spleen on day 3 and 7. (D) Frequency of MDSC (CD11b+Ly6G+ and CD11b+Ly6C+) and macrophages (CD11b+F4/80+) in the tumor on day 3 and 7. Data are presented as the mean ± SD. P-values were calculated based on a Student’s t-test (n = 4 per group). *p < 0.05, **p < 0.01.

