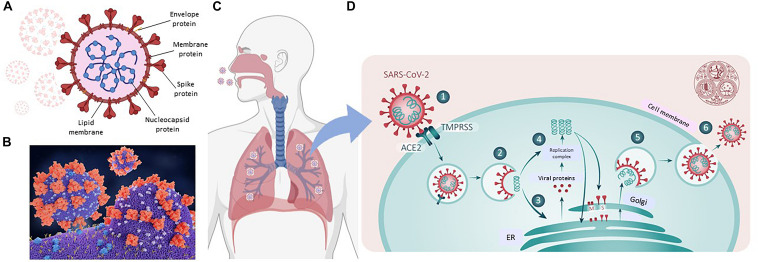
FIGURE 2.
SARS-CoV-2 and COVID19. (A) Representation of SARS-CoV-2 virus. (B) A molecular model showing the virus with spike proteins (red) and ACE2 (angiotensin converting enzyme 2) receptor (blue) on host cell surface. From Juan Gaertner/Science Photo Library, accessed 8/11/2020. (C) Covid19 entry via airways. (D) scheme showing TMPRSS activation of virus, followed by its internalization, processing and replication, Adapted from Ward P. et al. (2020). Available at: https://www.fpm.org.uk/blog/covid-19-sars-cov-2-pandemic. Accessed 8/11/2020.

