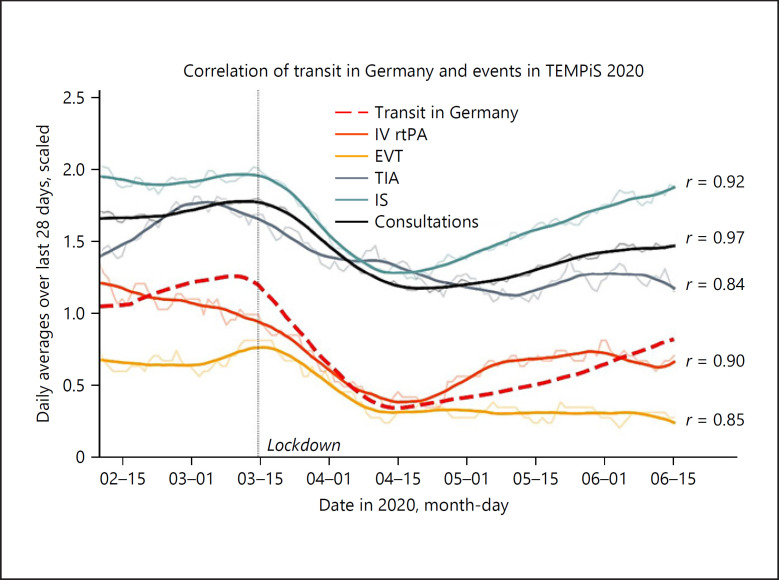
Fig. 4.
Correlations between events registered in TEMPiS and transit/public transportation in Germany. Shown in the background as semi-transparent are the moving averages of daily case numbers calculated for each day over the last 28 days (IV rtPA, EVT, TIA, IS, and Consultations). Pearson's correlation coefficients are shown as r on the right and were calculated based on unsmoothed averages on a daily basis for a time frame between February 9 and June 15, 2020 (both inclusive). Overlying are smoothed curves for graphical reasons. Values for TIAs are scaled to 1/2, values for IS to 1/4 and values for events overall to 1/10. Transit data are shown as red dashed line. These data are given as the ratio with the denominator (reference) being the value of transit on January 13, 2020. IS, ischemic stroke; IV rtPA, intravenous recombinant tissue plasminogen activator; EVT, endovascular thrombectomy; TIA, transient ischemic attack; ICH, intracranial hemorrhage.

