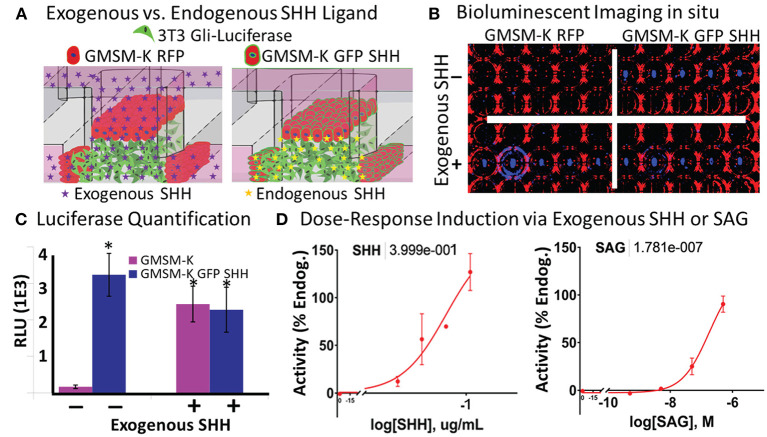
Figure 3.
Vital in situ quantification of endogenous and exogenous SHH ligand-induced pathway activity. (A) Experimental schematic shows incorporation of non-SHH-secreting and SHH-secreting epithelia and exogenously or endogenously derived SHH ligand. (B) Brightfield (red) and darkfield (blue) image of bioluminescent signal under different experimental conditions in a single plate. (C) Quantification of bioluminescent signal in (B) (*p < 0.05 vs. GMSM-K without exogenous SHH, Student's t-test). (D) Dose-response quantification of exogenously added SHH ligand (left) and SAG (right). Non-linear regression curve fit (Graphpad Prism). EC50 values shown above.

