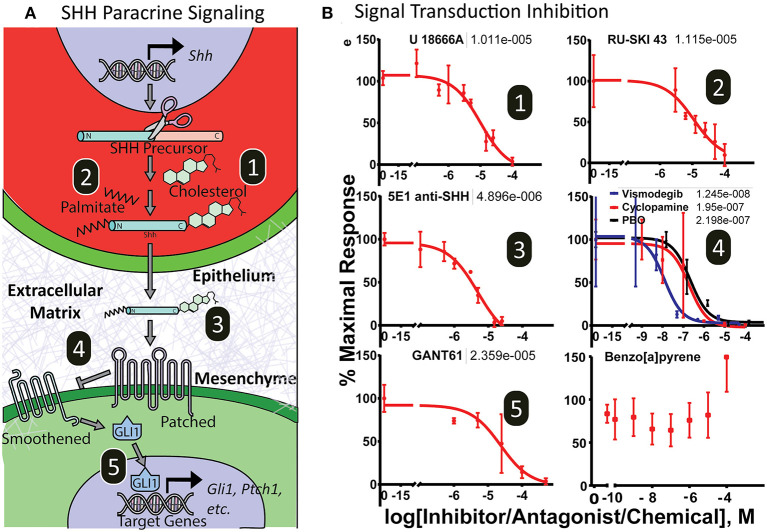
Figure 5.
Dose-response curves of SHH pathway inhibitors. (A) Illustration of the Sonic hedgehog inter- and intracellular transduction pathway with important molecular targets numbered. (B) Microtissues show dose-response inhibition of endogenously derived SHH-induced pathway activity by xenobiotics targeting epithelial secretory SHH ligand cholesterol modification (1) and SHH palmitoylation modification (2); extracellular SHH ligand trafficking (3); and mesenchymal receptor SHH sensing and signal transduction by Patched/Smoothened (4) and Gli-driven transcription (5). The chemical 3-benzo[a]pyrene did not antagonize the pathway. Non-linear regression curve fit (Graphpad Prism). EC50 values shown above.

