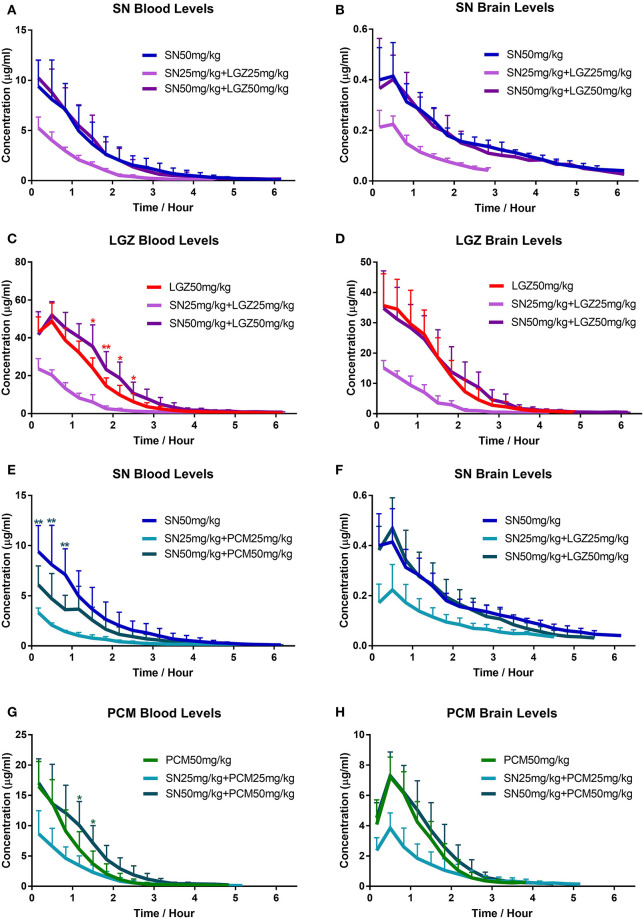
Figure 5.
Investigation of pharmacokinetics changes of SN, LGZ, and PCM in combined formulas. Drug concentrations of SN, LGZ, and PCM in blood (A,C,E,G) and striatum of the brain (B,D,F,H) were monitored continuously in collected samples (using microdialysis), after intravenous injection of SN, LGZ, and PCM at 50 mg/kg or SN combine with LGZ/PCM at 50 or 25 mg/kg, in rats. N = 6 rats for each group. Data was presented as mean ± SD. Two Way ANOVA indicated significant differences between the groups (A–H). *P < 0.05, **P < 0.01, drug concentrations of different groups were compared at each time points using Bonferroni's multiple comparisons test following ANOVA (significant differences with specific groups were illustrated by respective representing colors).

