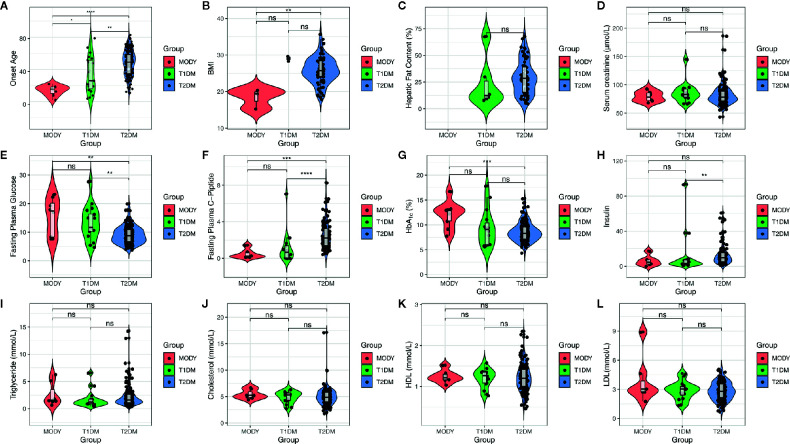
Figure 1.
Clinical characteristics of subjects. X axis indicates the clinical characteristics of subjects, which including age, BMI, hepatic fat content, serum creatinine, FPG, FPGC-piptide, HbA1 c, insulin, triglyceride, cholesterol, HDL, and LDL. And the colors of figure represent three diabetic group, MODY (red), T1DM (green), and T2DM (blue), respectively. The box plot is inside violin plot and the asterisk represents the significance between pairwised comparison. ns, p > 0.05; *p <= 0.05; **p <= 0.01; ***p <= 0.001; ****p <= 0.0001.

