Figure 3.

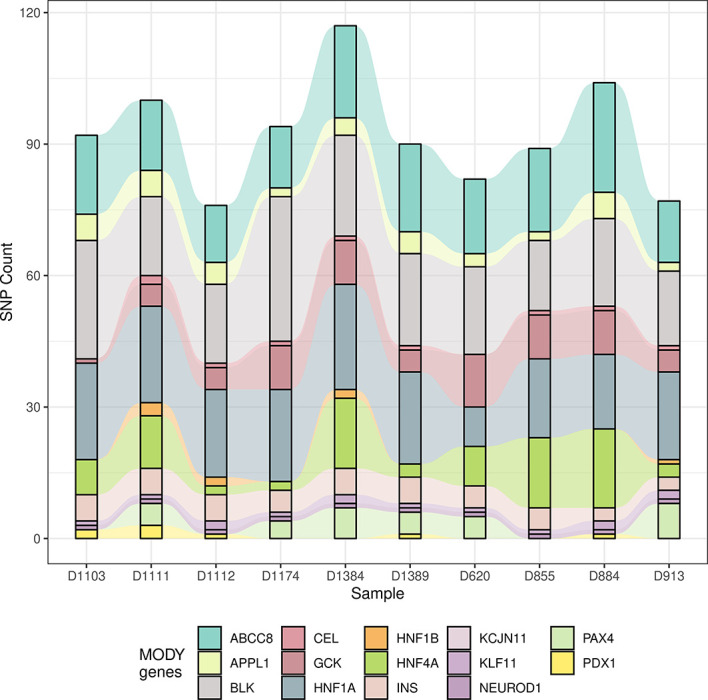
The count of mutation in 14 MODY genes. The alluvial diagram drawed by the count of mutation in 14 MODY genes. X axis indicates the name subjects and Y axis indicates the count of mutation. Different colors represent different genes.

The count of mutation in 14 MODY genes. The alluvial diagram drawed by the count of mutation in 14 MODY genes. X axis indicates the name subjects and Y axis indicates the count of mutation. Different colors represent different genes.