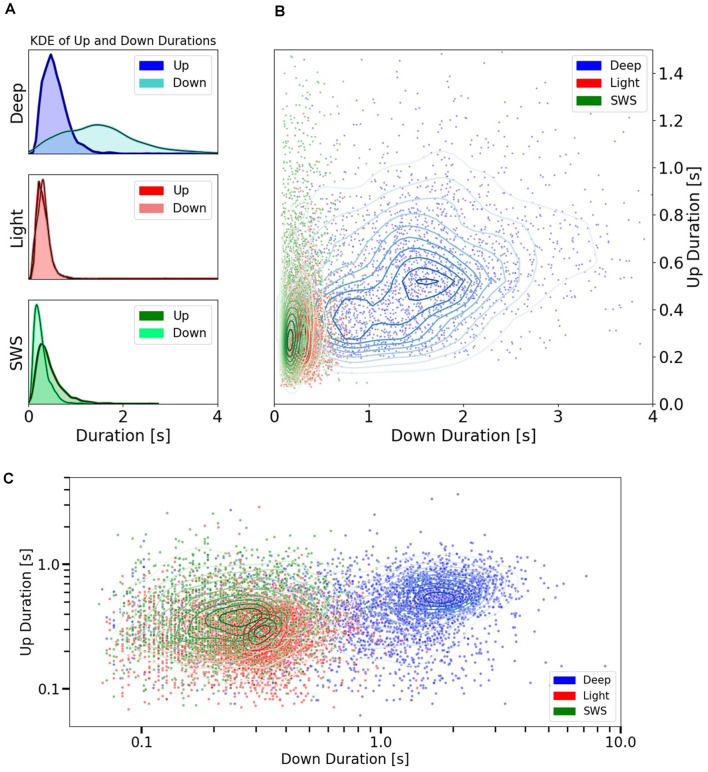
Figure 3.
Up and Down state durations in different anesthesia levels and SWS. (A) Univariate (1D) KDE (Kernel Density Estimation) for Up and Down state durations in three different conditions: deep anesthesia, light anesthesia, and SWS. (B) Scatter plot showing the space of durations for Up and Down cycles. Each point represents the duration of an Up vs. the duration of the subsequent Down. They are colored by conditions: Deep and Light anesthesia or SWS. Irregular ellipses stand for the bivariate (2D) KDE for both Up and Down durations in each of these conditions. (C) Scatter plot of Up vs. Down durations in the three conditions (deep and light anesthesia and SWS) represented with a logarithmic scale.

