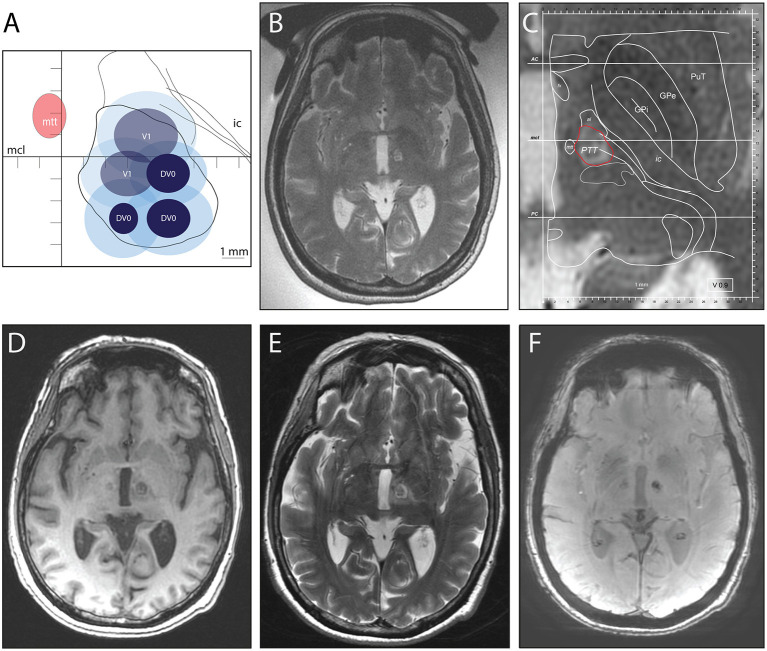
Figure 1.
Second side (left hemisphere) pallidothalamic tractotomy (PTT) performed 17 months after right-sided PTT. (A) There were 18 cumulative equivalent minutes (CEM; light blue) and 240 CEM (dark blue) thermal dose surfaces projected on a standardized PTT targeting map [modified from Gallay et al. (32)]. Target sub-units were realized either at the intercommissural plane (DV0) or 1 mm below (V1). (B) Intraoperative MR axial T2 image of the performed target (with the body coil and transducer filled with water). (C) Enlarged intraoperative MR T2 axial image with projected modified version of plan DV0 of Morel's Atlas (22). In red, outline of the planned PTT target. At 2 days after PTT: MR axial T1 image (D), T2 image (E), and susceptibility weighted angiography image. The first right-side PTT is visible in (D, F).

