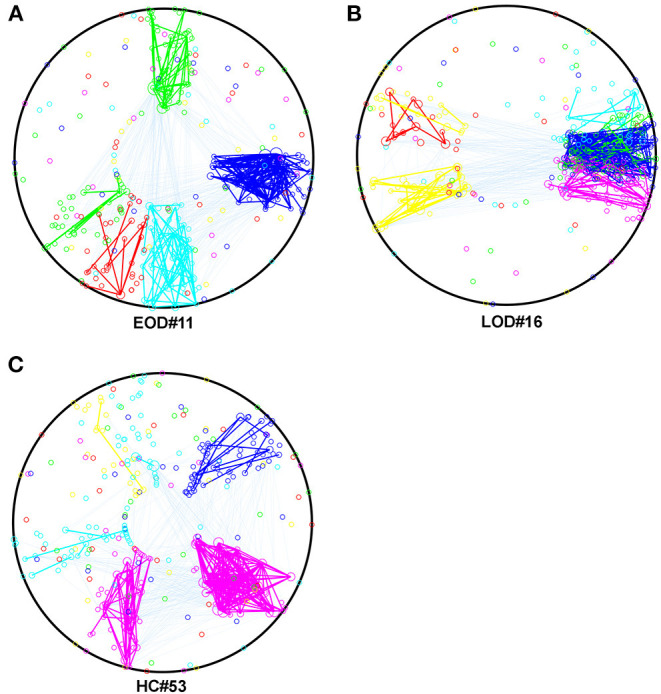
Figure 2.

(A–C) The within and between module connection in EOD, LOD, and HC, respectively in 2% sparsity network, the within module connections were represented by the same color of the module, the between module connections were cyan. The color of the module was determined by the script randomly. Mapping was using The Community Detection Toolbox and Maltab home make program.
