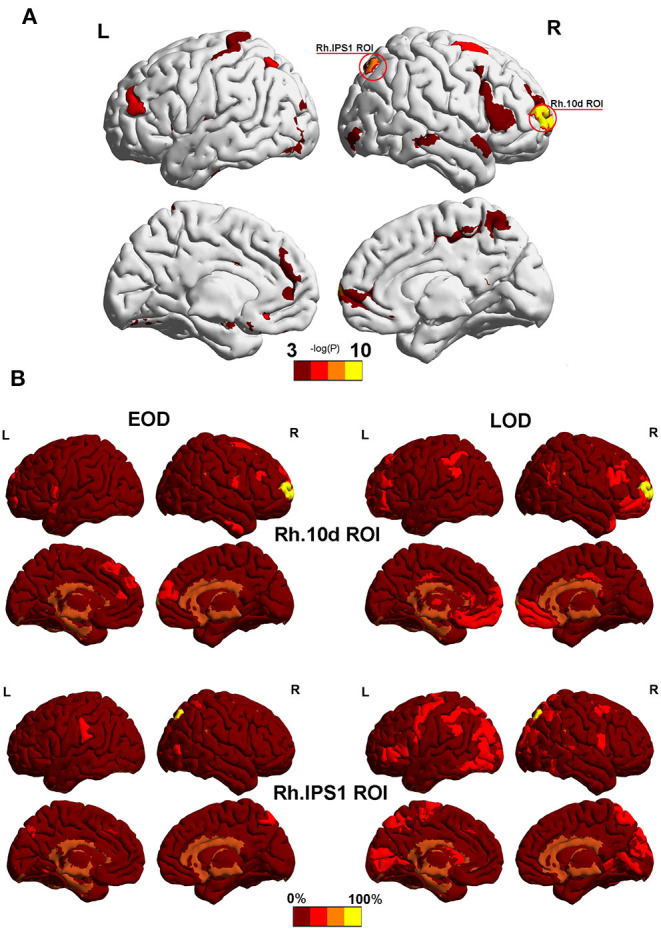
Figure 3.

(A) The most significantly different partitioned nodes detected by the Phi coefficient in the 2% sparsity network. The yellow area was Rh.10d.ROI and Rh.IPS1.ROI in the HCP-MMP 1.0 atlas. (B) Other nodes with the same module as Rh.10d.ROI and Rh.IPS1.ROI. Color bar represents the percentage of subjects. Mapping was performed using BrainNet Viewer software (http://www.nitrc.org/projects/bnv/).
