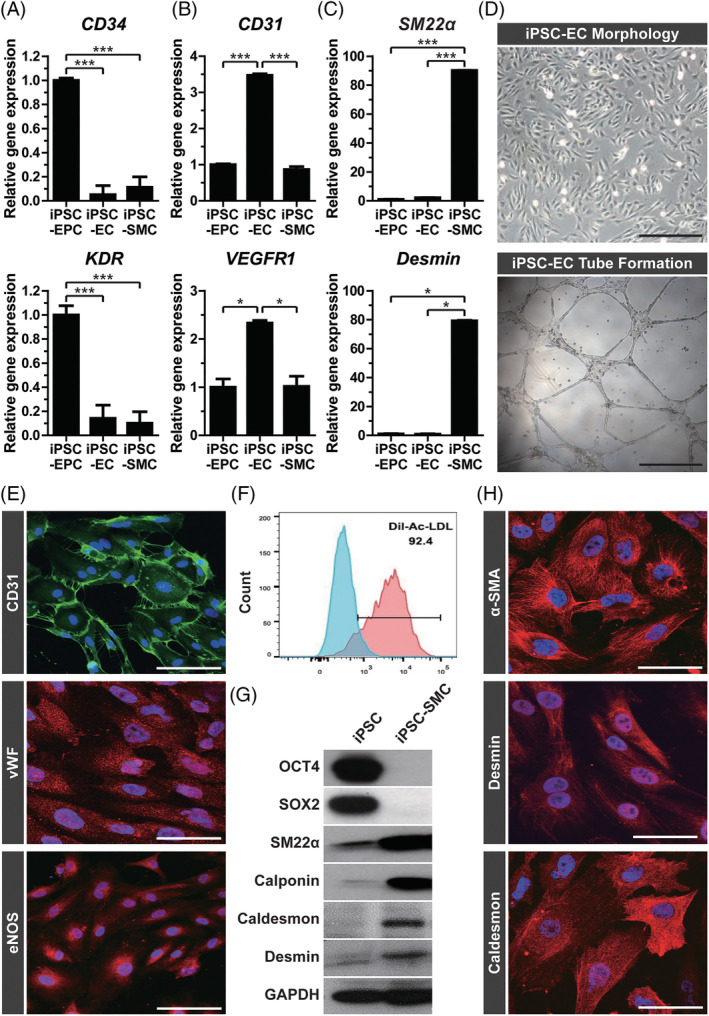
FIGURE 2.

Characterization of induced pluripotent stem cell (iPSC)‐derived endothelial cells and iPSC‐derived smooth muscle cells. Gene expression of iPSC‐vascular progenitor cell (VPC), ‐endothelial cell (EC), and ‐smooth muscle cell (SMC) was assessed by quantitative reverse transcription‐polymerase chain reaction (RT‐PCR) of (A) vascular progenitor cell markers (CD34 and KDR), (B) endothelial markers (CD31 and VEGFR1), and (C) smooth muscle markers (SM22α and Desmin). Results are presented as mean ± SD (n = 3). *P < .05; **P < .01; ***P < .001. D, Representative images of adherent cells and tube formation by iPSC‐EC are shown. Scale bar = 200 μm. E, The iPSC‐EC, on day 3 after sorting, were subjected to immunofluorescence staining using antibodies against CD31 (green), vWF (red), and eNOS (red). Nuclei were counterstained with DAPI (blue), and the merged images are shown. Scale bar = 50 μm. F, Flow cytometric analysis of iPSC‐EC after sorting are shown. Ac‐LDL uptake was measured after incubating the cells with Ac‐LDL. No Ac‐LDL treatment is a negative control. G, Western blot analysis of iPSC and iPSC‐SMC using pluripotency markers (OCT4 and SOX2), smooth muscle markers (SM22α, Calponin, Caldesmon, Desmin), and GAPDH is shown. H, Representative images for immunocytochemistry of iPSC‐SMC at day 4 after sorting are shown. Confocal images of iPSC‐SMC after immunolabeling with antibodies against α‐SMA, Desmin, and Caldesmon are shown (red). Nuclei were counterstained with DAPI (blue), and the merged images are shown. Scale bar = 50 μm
