
FIGURE 2.
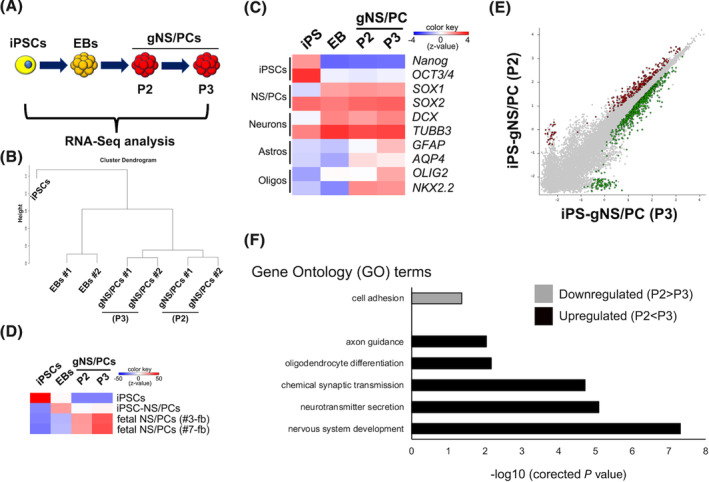
Transcriptomic characterization of feeder‐free hiPSCs (ffiPSC)‐gNS/PCs. A, Transcriptome analysis of ffiPSCs (iPSCs), ffiPSC‐EBs (EBs), and ffiPSC‐gNS/PCs (gNS/PCs) (P2 and P3) by RNA‐seq. B, Dendrogram clustering of iPSCs, EBs, and gNS/PCs (P2 and P3) based on global gene expression. Samples were taken from two independent experiments to generate gNS/PCs from ffiPSCs (#1 and #2). C, Heatmap displaying normalized expression (z‐score) of iPSC‐specific (NANOG and OCT3/4), NS/PC‐specific (SOX1 and SOX2), neuron‐specific (DCX and TUBB3), astrocyte‐specific (GFAP and AQP4), and oligodendrocyte‐specific (OLIG2 and NKX2.2) genes in iPSCs, EBs, and gNS/PCs (P2 and P3). D, Correlation analysis of gene expression in iPSCs, EBs, and gNS/PCs with the gene expression profiles of the indicated cell types (iPSCs, iPSC‐NS/PCs, human fetal NS/PCs). The published gene expression profiles of iPSCs, iPSC‐NS/PCs, and human fetal NS/PCs were loaded from GSE76900. E, A scatter plot was used to assess differences in gene expression between gNS/PCs (P2) and gNS/PCs (P3). The genes labeled green (306 genes) or red (714 genes) have a >1.5‐fold change in expression between the two groups. F, GO analysis of downregulated and upregulated genes in P3 gNS/PCs compared to P2 gNS/PCs. Enrichment of corresponding GO terms is shown. EBs, embryoid bodies; gNS/PCs, neural stem/progenitor cells with gliogenic competence; GO, gene ontology; iPSCs, induced pluripotent stem cells