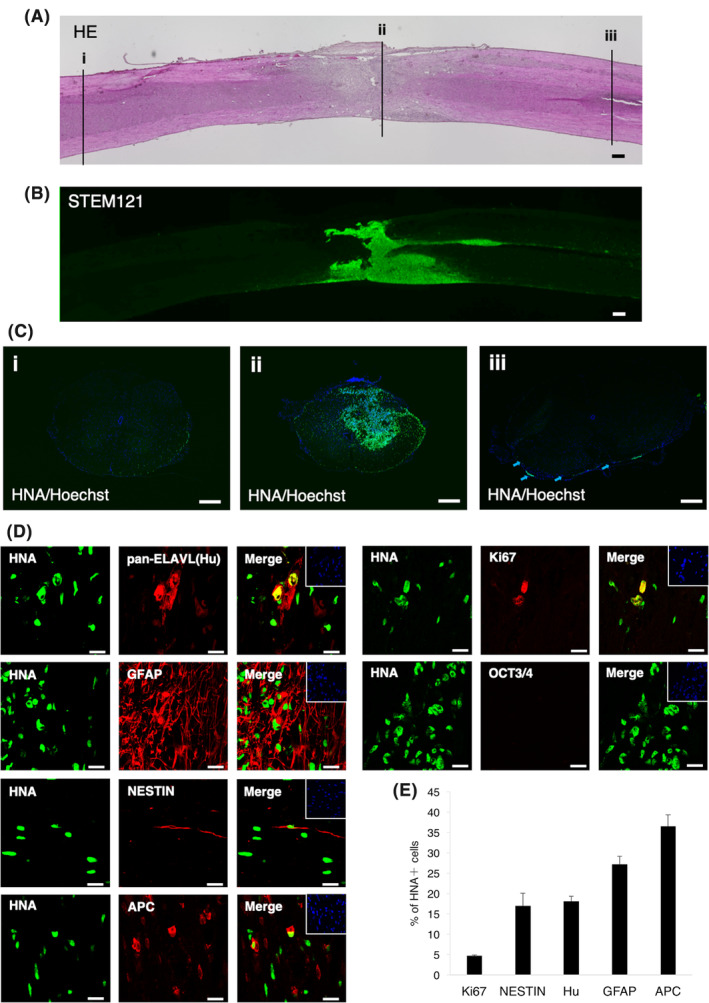
FIGURE 4.

Differentiation potential of feeder‐free hiPSCs (ffiPSC)‐gNS/PCs after transplantation. A, Representative H&E‐stained images of sagittal sections of the spinal cord 12 weeks after transplantation. Positions of three axial section images in (C) are indicated with numbered lines. Scale bar = 200 μm. B, The distribution of transplanted cells was visualized by STEM121 immunoreactivity. The survival of transplanted cells at the lesion epicenter was confirmed. Scale bar = 200 μm. C, Human nuclear antigen (HNA) staining of axial sections at positions indicated in (A). The HNA+ grafted cells were integrated at the lesion epicenter (ii) and migrated rostrally (i) and caudally (iii). Scale bars = 200 μm. D, Characterization of the transplanted cells was determined using the cell type‐specific markers indicated in the figure. Representative images of HNA+ grafted cells together with Ki67, OCT3/4, NESTIN, pan‐ELAVL (Hu), GFAP, and adenomatous polyposis coli (APC) staining. Insets: Hoechst nuclear staining of each field. Scale bars = 20 μm. E, Quantification of the frequency of cell type‐specific marker‐positive cells among HNA+ transplanted cells 12 weeks after transplantation. GFAP, glial fibrillary acidic protein; gNS/PCs, neural stem/progenitor cells with gliogenic competence
