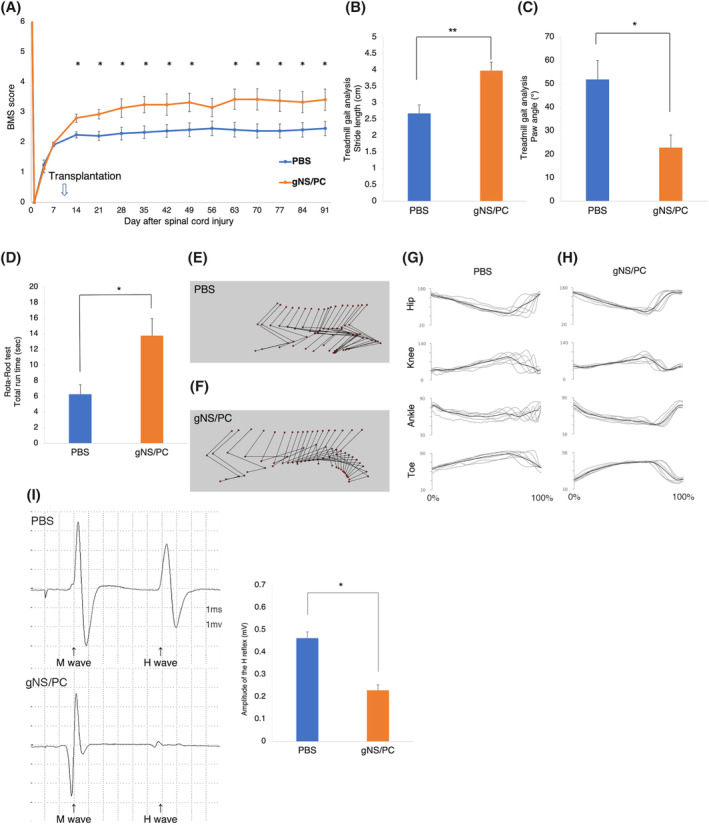
FIGURE 6.

Motor function analyses after transplantation of feeder‐free hiPSCs (ffiPSC)‐gNS/PCs. A, Comparison of Basso Mouse Scale (BMS) scores between the PBS and ffiPSC‐gNS/PCs groups. The BMS scores showed significantly functional recovery in the ffiPSC‐gNS/PCs group compared with that in the PBS group at 14 days after SCI and thereafter. Values are means ± SEM (control group, n = 12; ffiPSC‐gNS/PCs group, n = 14; *P < .05). B,C, Comparison of stride lengths (B) and paw angles (C) between the PBS and ffiPSC‐gNS/PCs groups. Treadmill gait analysis was performed at 12 weeks after transplantation using the DigiGait system. Stride length and stance angle were significantly longer and more parallel, respectively, in the ffiPSC‐gNS/PCs group than in the PBS group. Values are means ± SEM (control group, n = 12; ffiPSC‐gNS/PCs group, n = 14; *P < .05 **P < .01). D, Comparison of rotarod test results between the PBS and ffiPSC‐gNS/PCs groups. The rotarod test was performed at 12 weeks after transplantation. The ffiPSC‐gNS/PCs group ran on the rod for significantly longer than the PBS group. Values are means ± SEM (control group, n = 12; ffiPSC‐gNS/PCs group, n = 14; *P < .05). E,F, Representative kinematics stick diagrams at 12 weeks after transplantation. G,H, Mean (SD) waveforms of hip (Hip), knee (Knee), ankle (Ankle), and toe (Toe) joint angle during treadmill locomotion. I, Comparison of H‐reflex between the PBS and ffiPSC‐gNS/PCs groups using electrophysiological analyses at 12 weeks after transplantation. The amplitude was significantly smaller in the ffiPSC‐gNS/PCs group than in the PBS group. Values are means ± SEM. gNS/PCs, neural stem/progenitor cells with gliogenic competence; PBS, phosphate‐buffered saline
