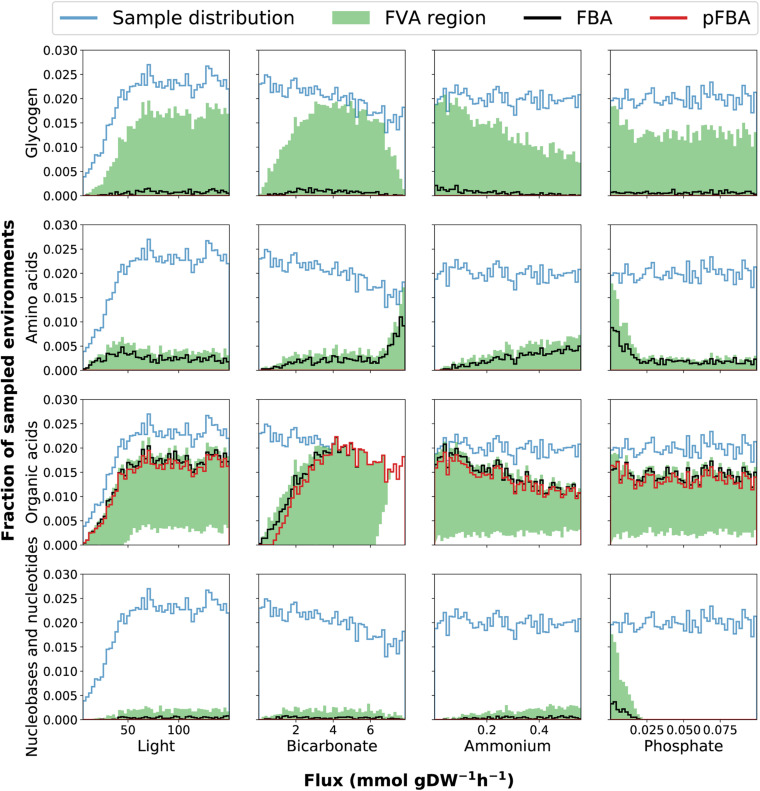
FIGURE 3.
Histograms of environmental sampling results provide insight into how the fixed uptake rates of light and bicarbonate and the upper bounds on ammonium and phosphate affect exudation of organic acids, nucleobases and nucleotides, amino acids as well as glycogen storage. The y-axis represents the fraction of all sampled environments yielding feasible models. Although we initially sample each parameter uniformly the final sample distribution is not uniform because some combinations of parameters represent infeasible phenotypes (no solution can satisfy the constraints). The final sample distribution for each parameter is therefore shown in the figure panels as a blue line. The black and red lines represent the histograms of samples where exudation is predicted by FBA and pFBA, respectively. The shaded green region represents the span between histograms of samples as predicted by FVA: the lower and upper bounds represent the number of samples where exudation is predicted using the minimum and maximum value of FVA, respectively. This FVA region covers the range of possible phenotypes. The lower bound of the FVA region displays the number of samples where a certain outcome is obligatory to maximize growth, while the upper bound of the FVA region displays the number of samples where the outcome is possible without reducing growth.

